Report Examples from Our Previous Projects
At Versich, we don’t just talk about data transformation, we deliver it. Our Power BI portfolio highlights projects across industries where we’ve helped clients unlock insights, improve decision making, and achieve measurable ROI. making, and achieve measurable ROI.
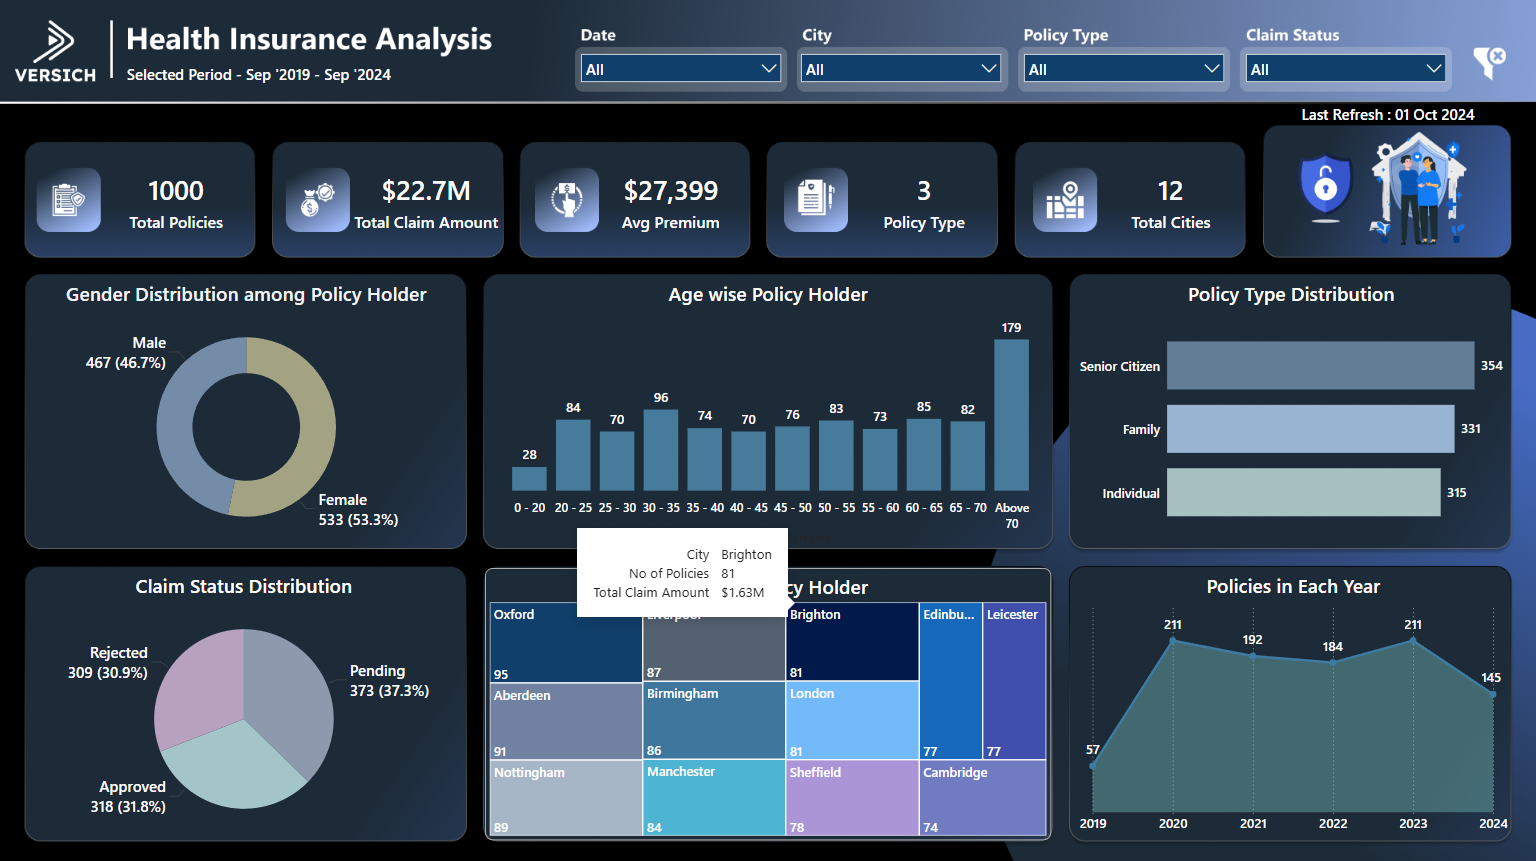
Health Insurance Analysis
The Health Insurance Analysis Power BI project delivers advanced insights into claims, policy performance, and customer demographics, empowering insurers with actionable intelligence for risk assessment and service improvement.
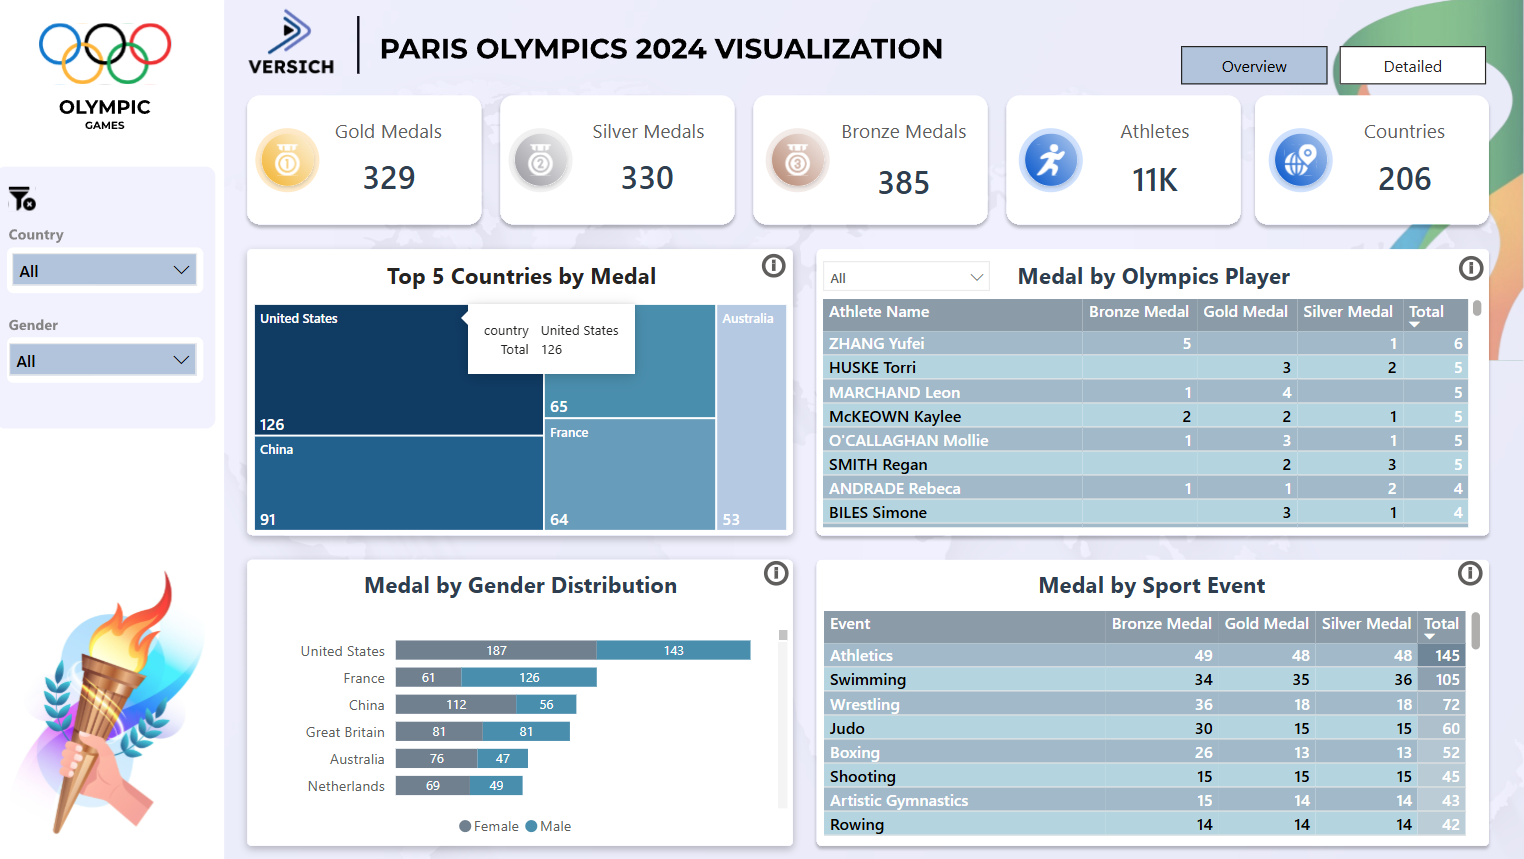
Paris Olympics 2024
The Paris Olympics 2024 Power BI project visualizes athlete and country performance, medal tallies, and event statistics, offering an engaging way to explore Olympic data.
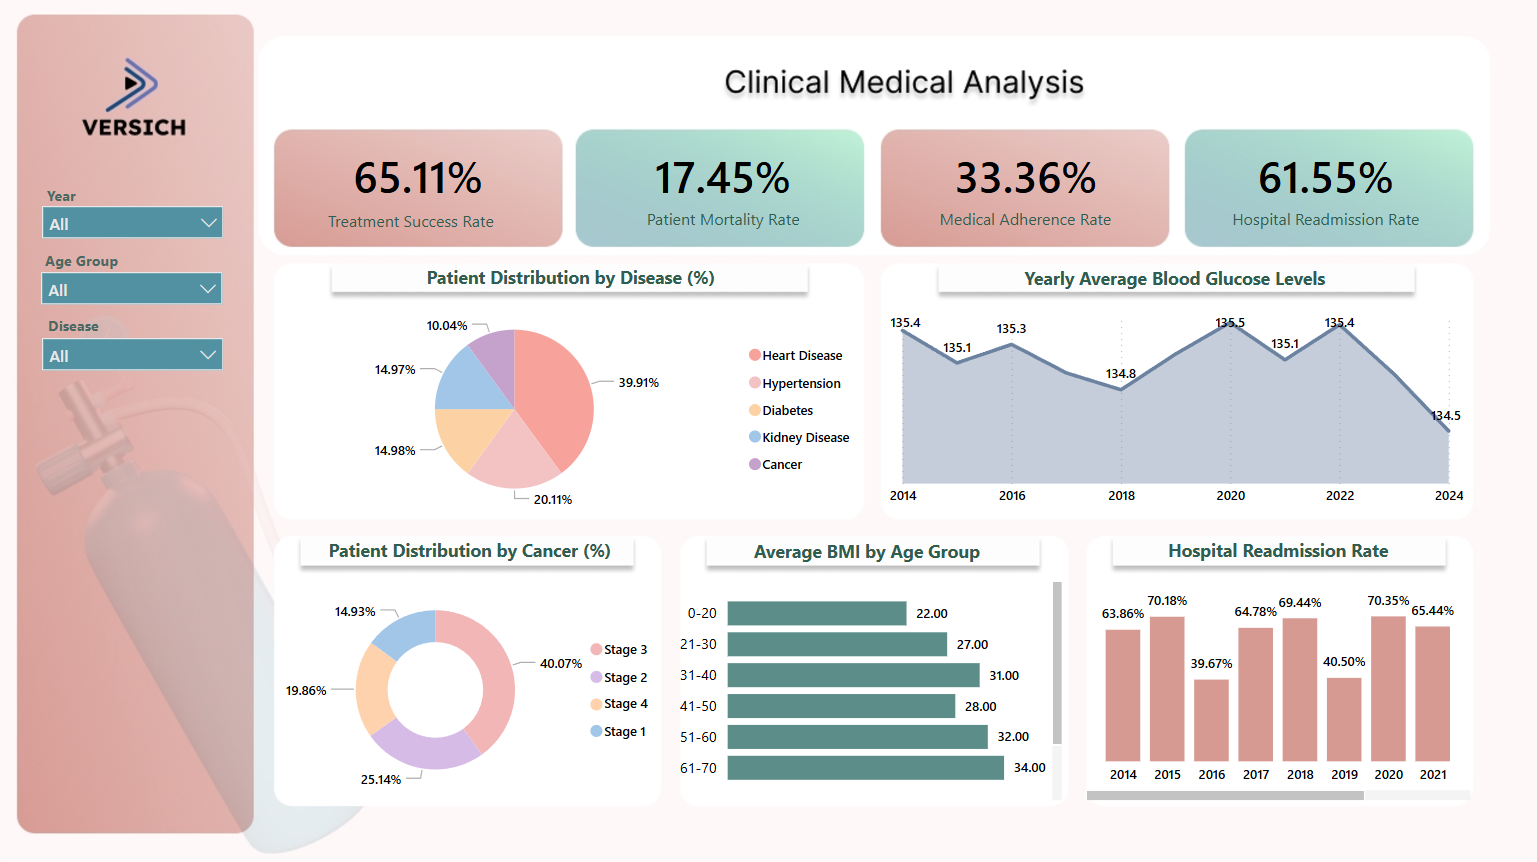
Clinical Medical Analysis
The Clinical Medical Analysis Power BI project provides detailed visualization of clinical data, enabling healthcare professionals to monitor patient outcomes and treatment effectiveness.
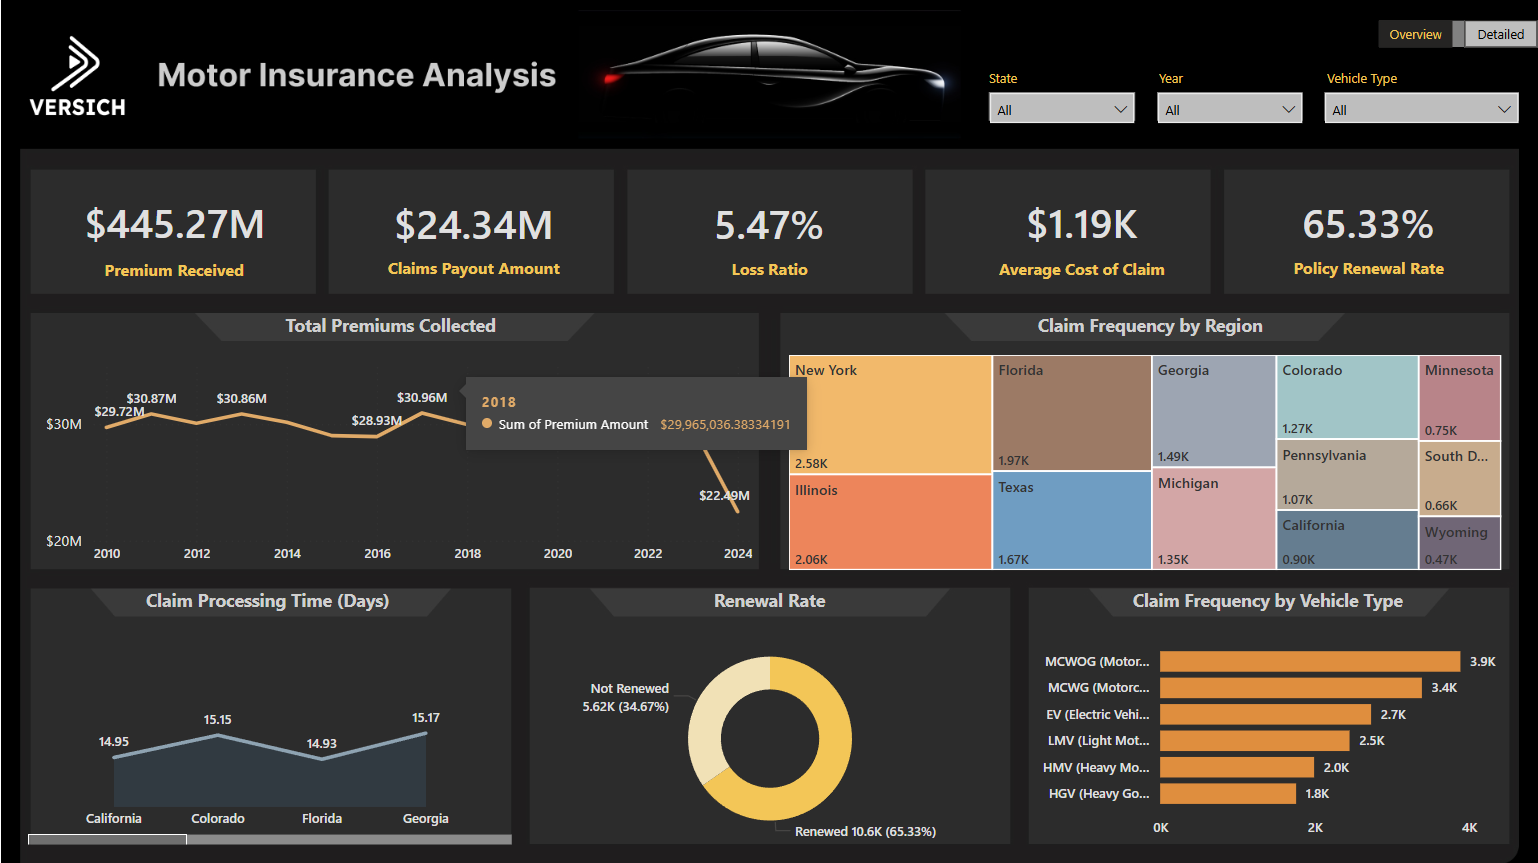
Motor Insurance
The Motor Insurance Power BI project delivers in-depth analysis of claims and policy metrics, helping insurers optimize offerings and improve customer service.
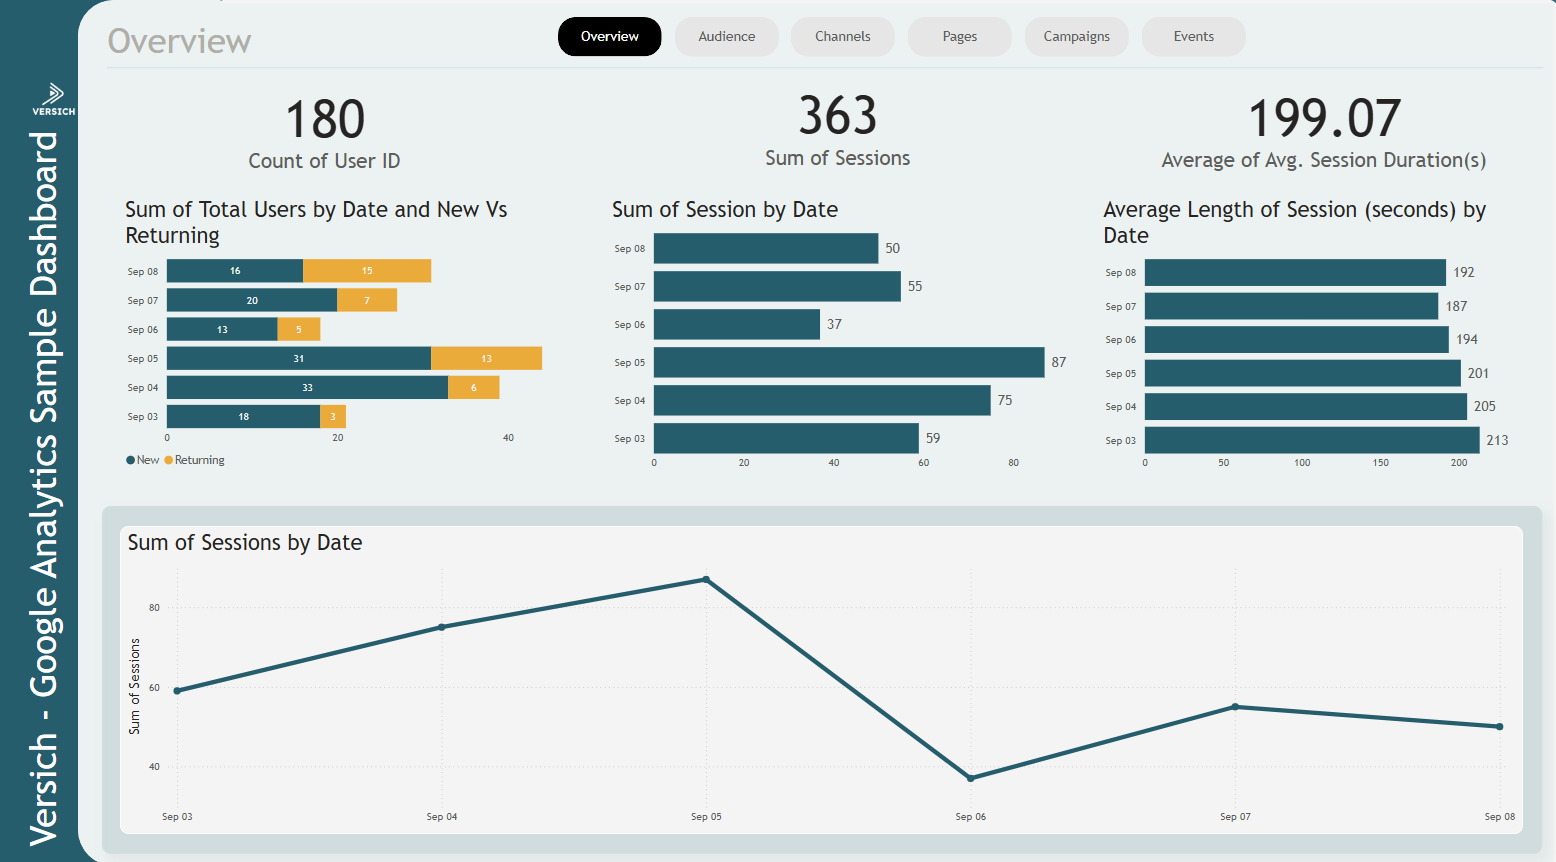
Google Analytics
The Google Analytics Power BI project transforms web traffic data into actionable insights, helping businesses optimize marketing and digital strategies.
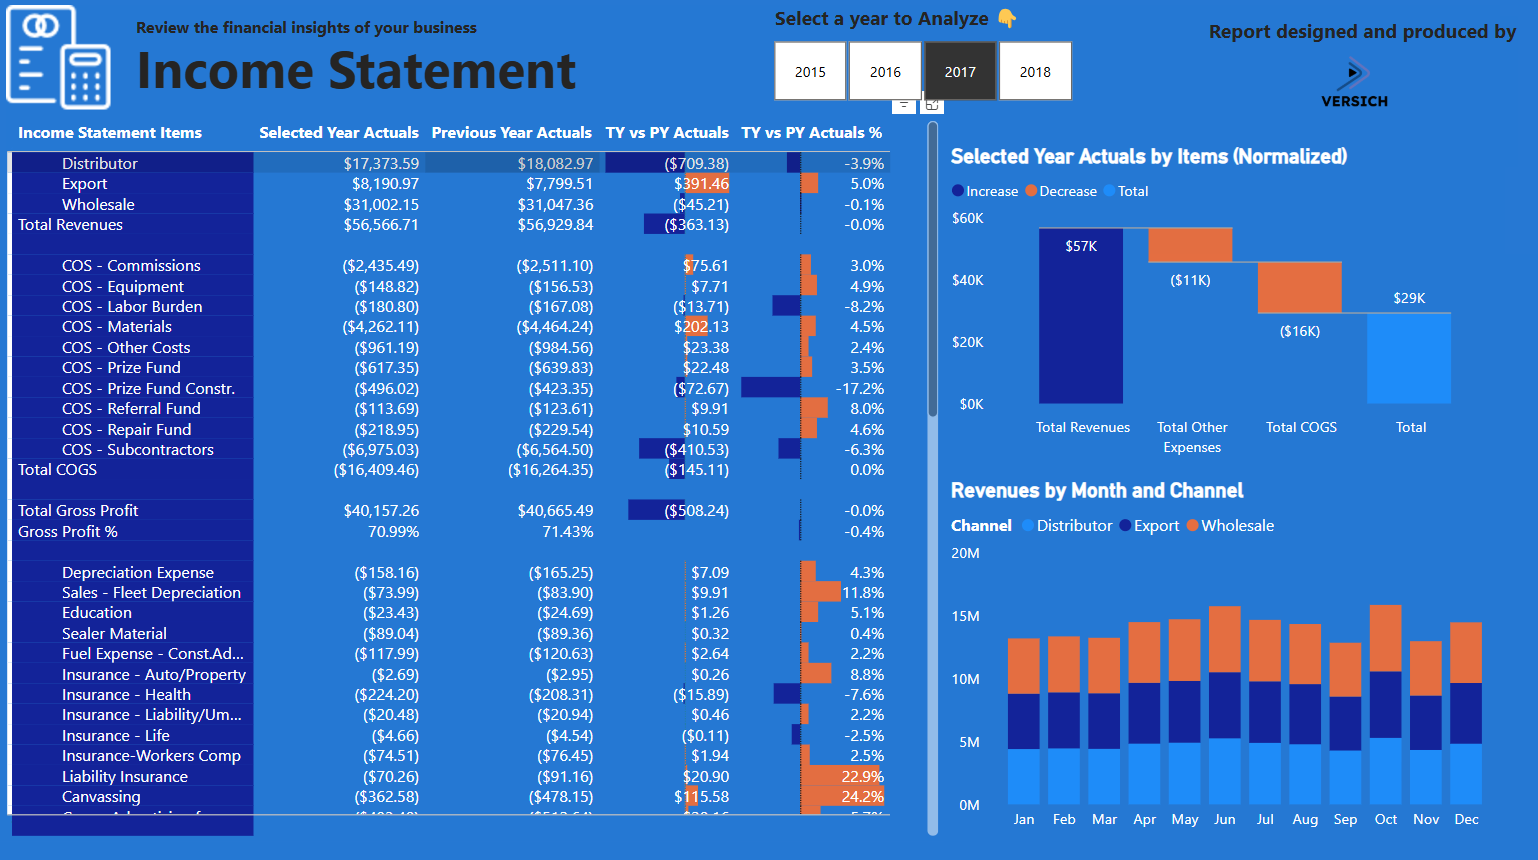
Income Statement
The Income Statement Power BI project provides comprehensive financial analysis, visualizing revenue, expenses, and profitability for performance evaluation.
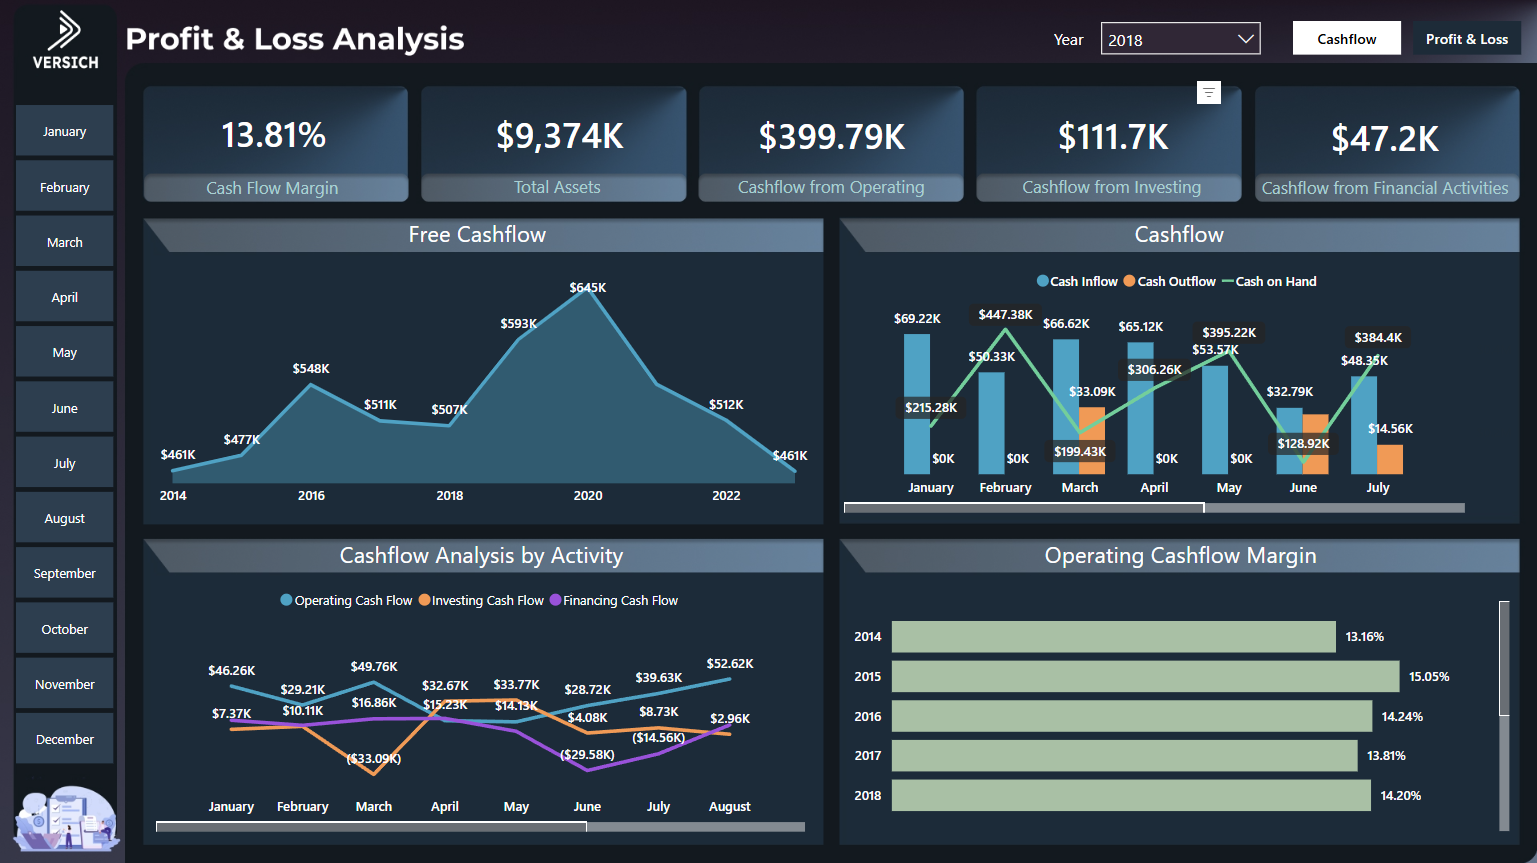
Cashflow and Profit & Loss Analysis
The Cashflow and Profit & Loss Analysis Power BI project offers a holistic view of financial health, tracking cash inflows, outflows, and profitability metrics.
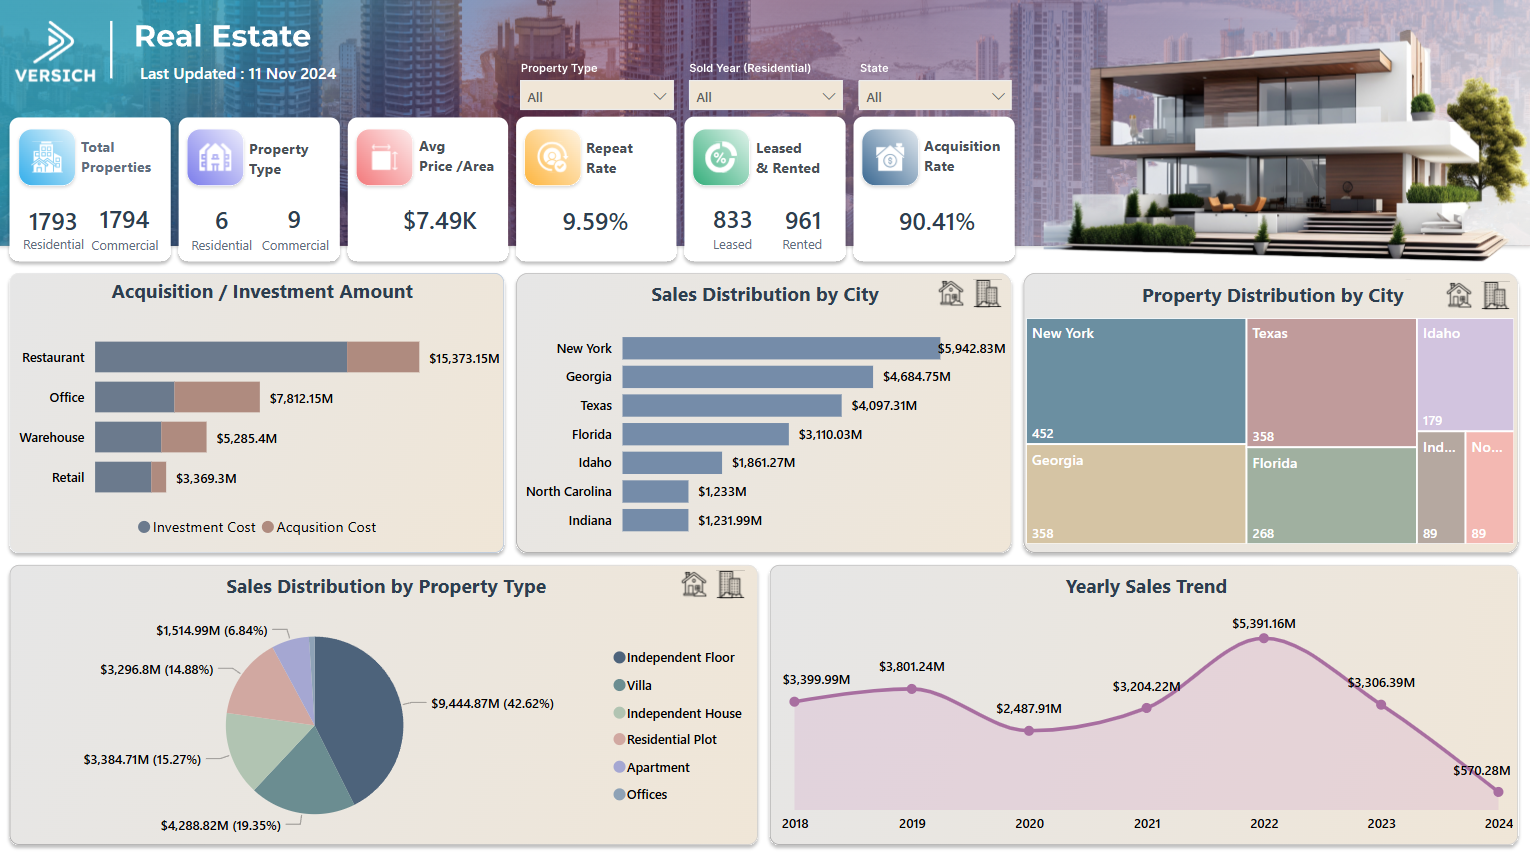
Real Estate Analysis
The Real Estate Analysis Power BI project provides detailed insights into property market trends, rental yields, and investment performance.
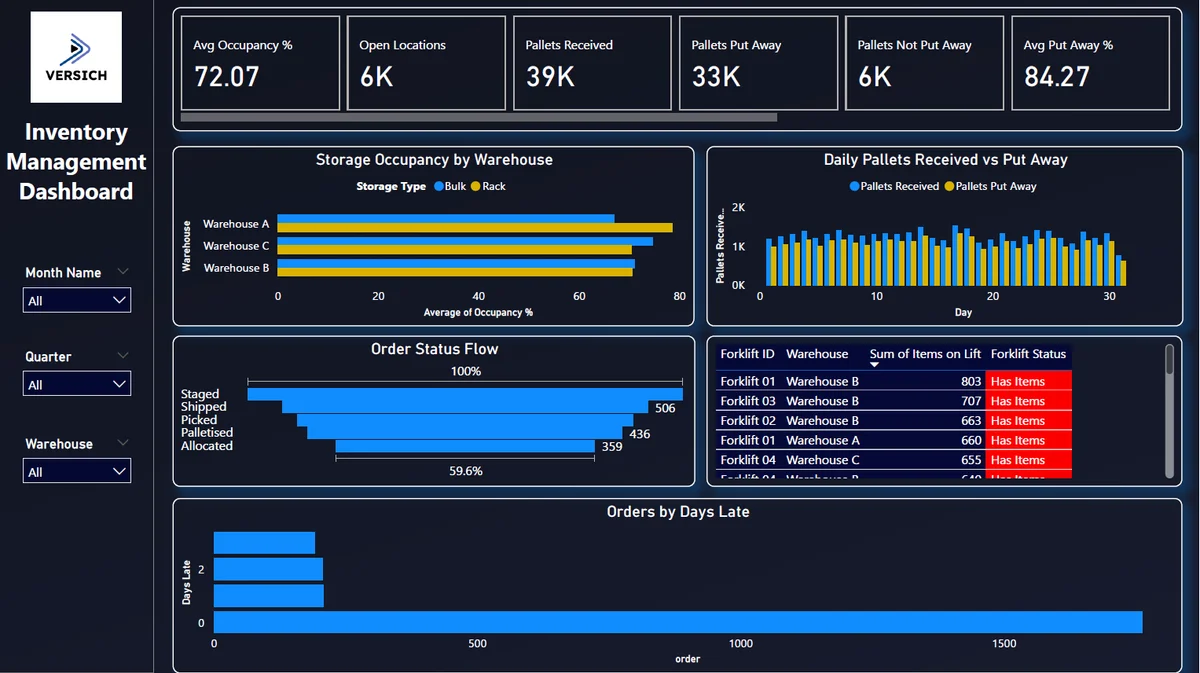
Inventory Management Dashboard
The Inventory Management Dashboard in Power BI provides insights into warehouse occupancy, pallet operations, order fulfillment, and forklift activity, helping logistics teams improve efficiency and maintain better inventory control.
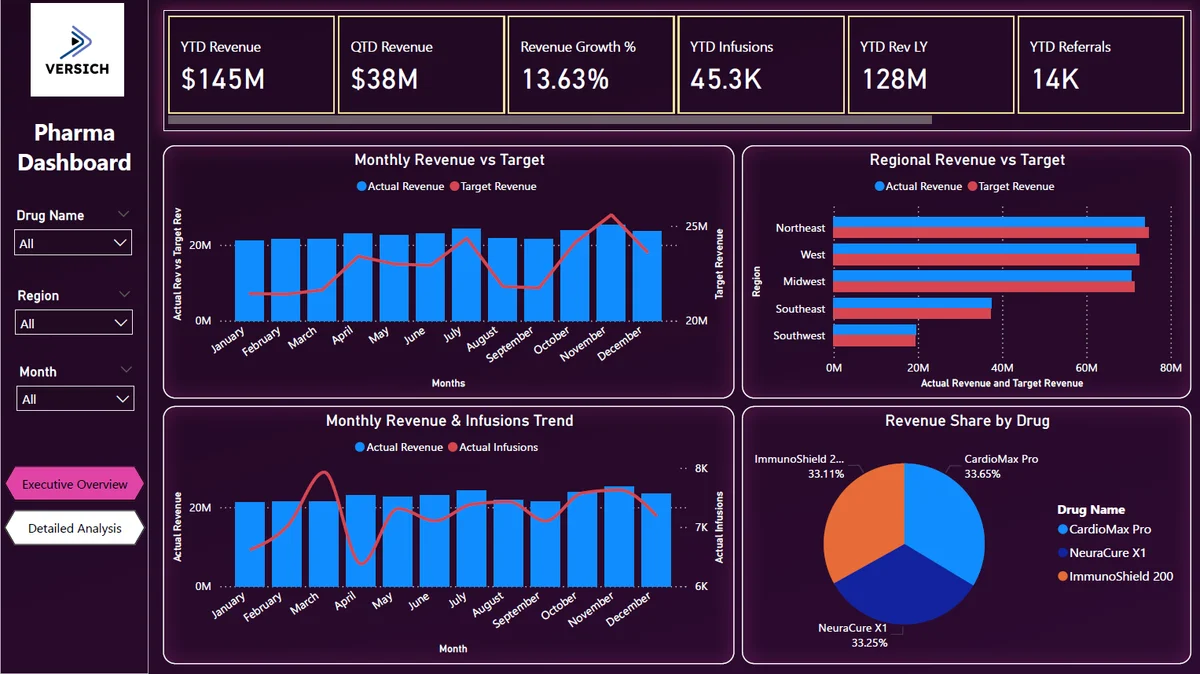
Pharma Dashboard
The Pharma Dashboard in Power BI provides insights into drug revenue, infusion trends, and regional sales targets, helping pharmaceutical companies drive strategic growth and improve operational performance.
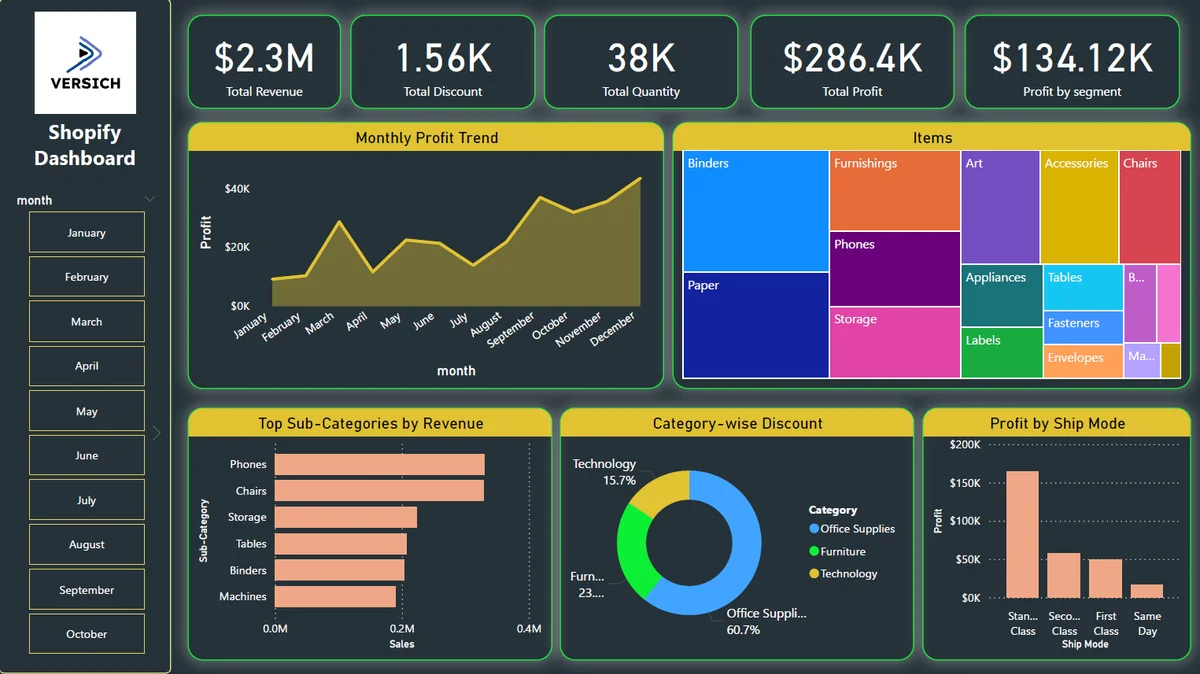
Shopify Dashboard
The Shopify Dashboard Power BI project delivers advanced insights into sales performance, revenue trends, and product category analytics, empowering businesses with actionable intelligence for growth strategy and operational decision-making.
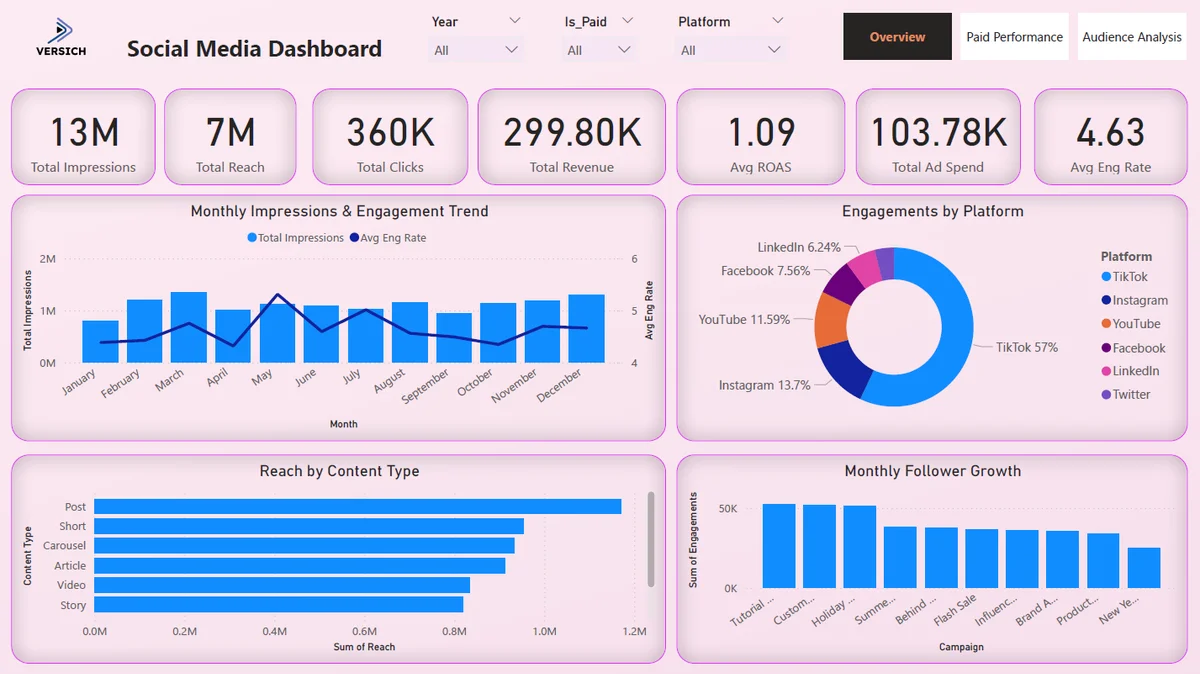
Social Media Dashboard
The Social Media Dashboard in Power BI provides insights into engagement, ad performance, and audience demographics, helping marketing teams optimize campaigns, improve targeting, and drive social media growth strategies.
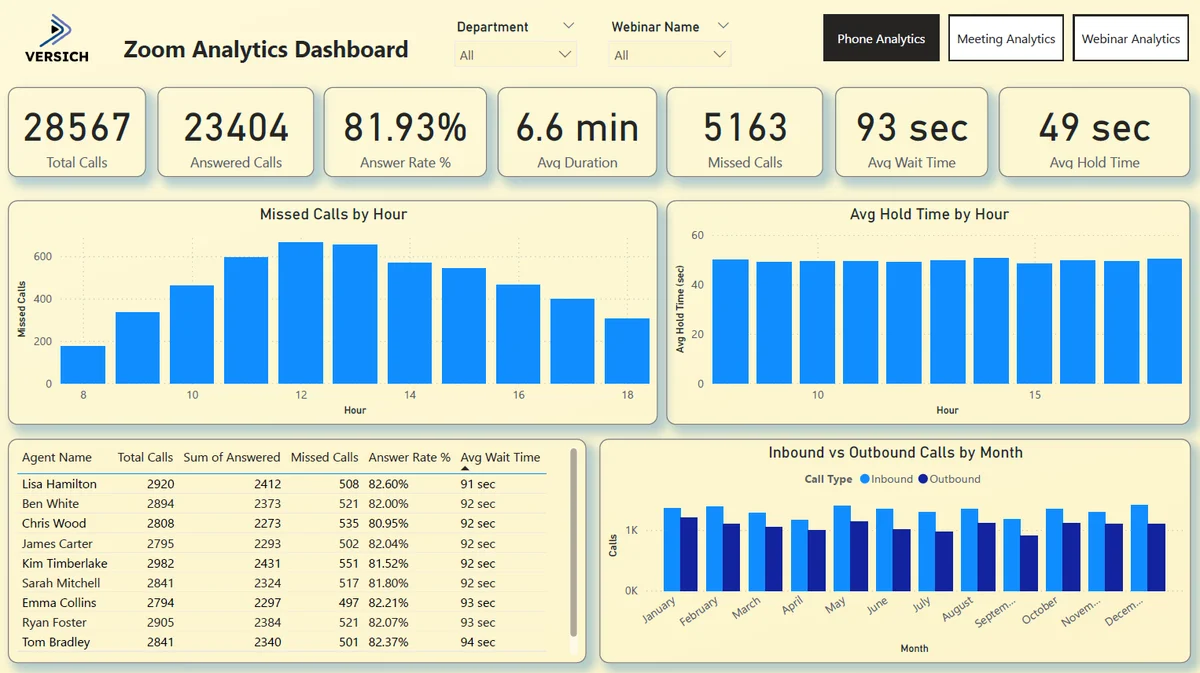
Zoom Analytics Dashboard
The Zoom Analytics Dashboard in Power BI provides insights into call performance, meeting activity, and webinar engagement, helping organizations improve communication efficiency, boost team productivity, and enhance audience reach.
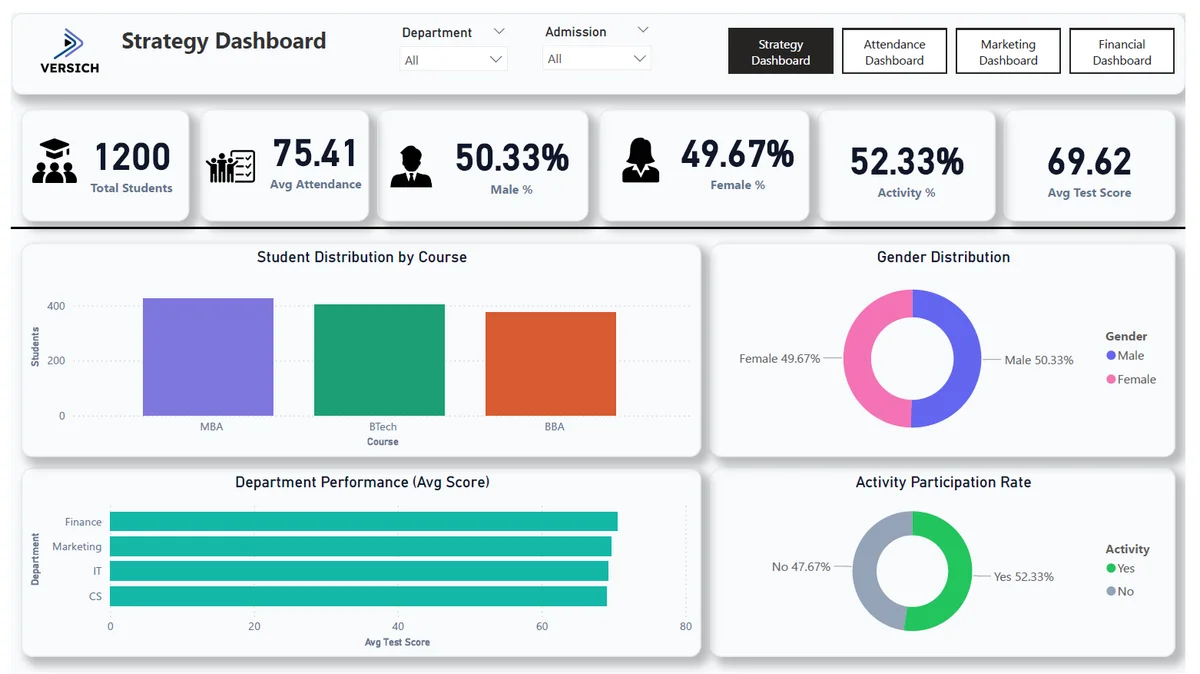
University & School Analytics Dashboard
The University & School Analytics Dashboard in Power BI provides insights into student performance, attendance trends, marketing effectiveness, and financial health, enabling institutions to make data-driven decisions and improve outcomes.
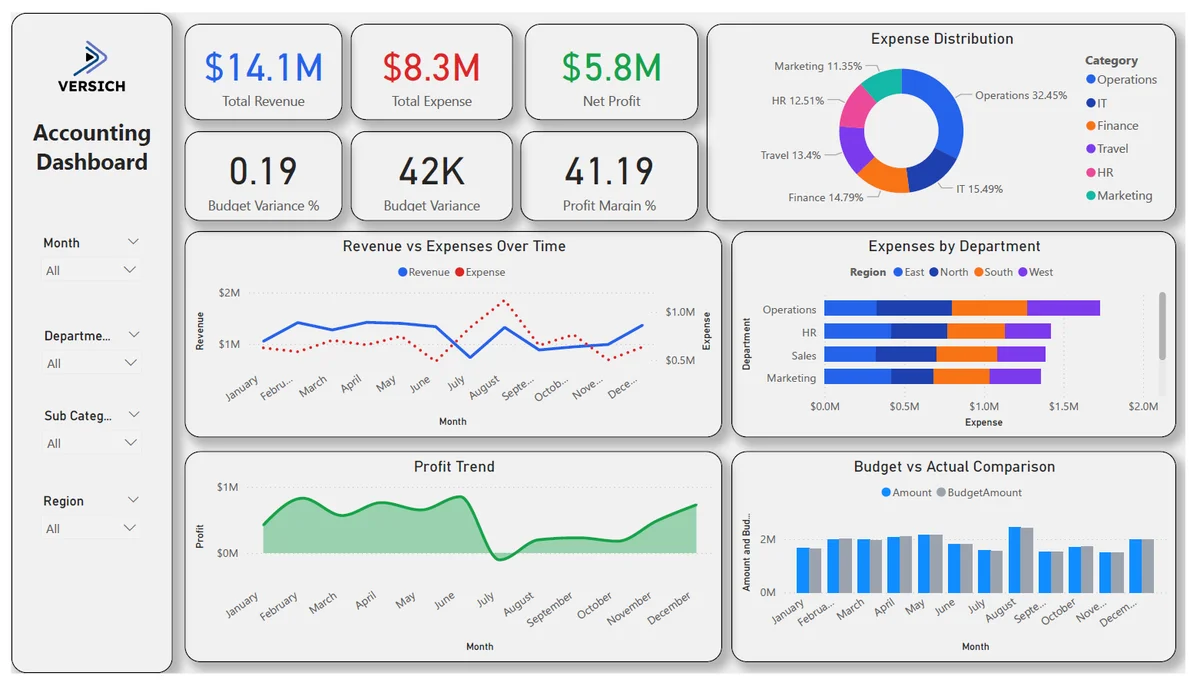
Accounting Dashboard
The Accounting Dashboard Power BI project provides detailed insights into revenue, expenses, profit margins, and budget performance, enabling finance teams to improve cost control, budget planning, and data-driven financial decision-making.
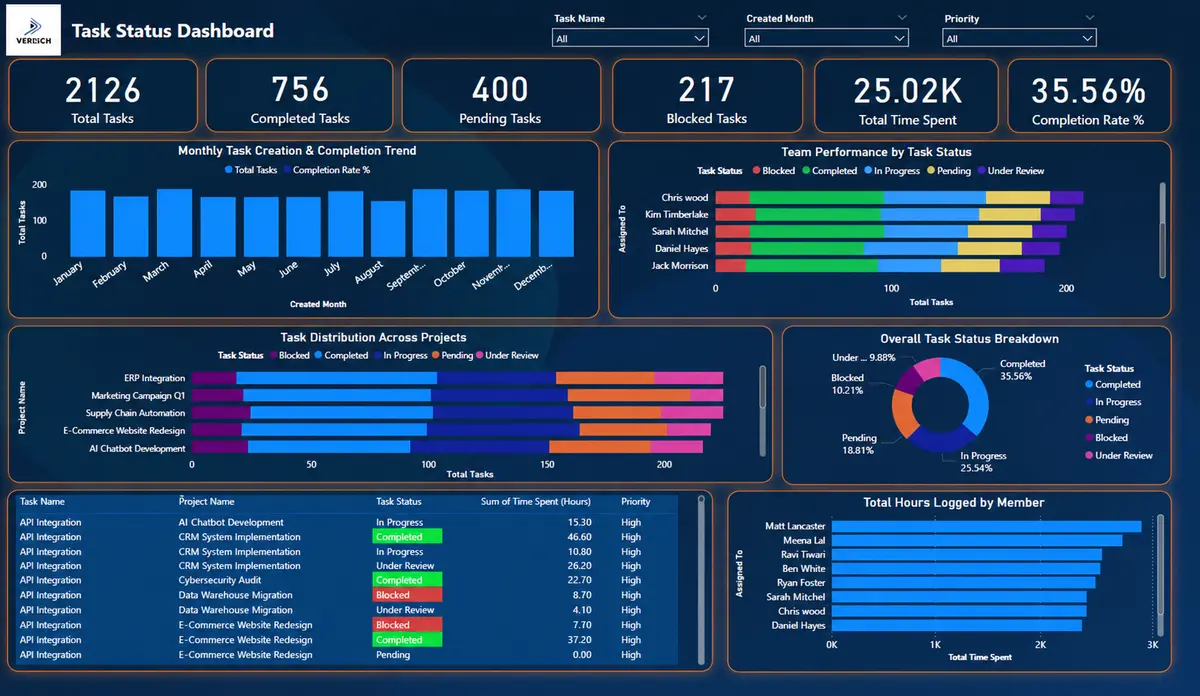
Task Status Dashboard
The Task Status Dashboard in Power BI provides insights into task completion, team performance, project distribution, and time tracking, helping managers improve productivity and manage workloads effectively.
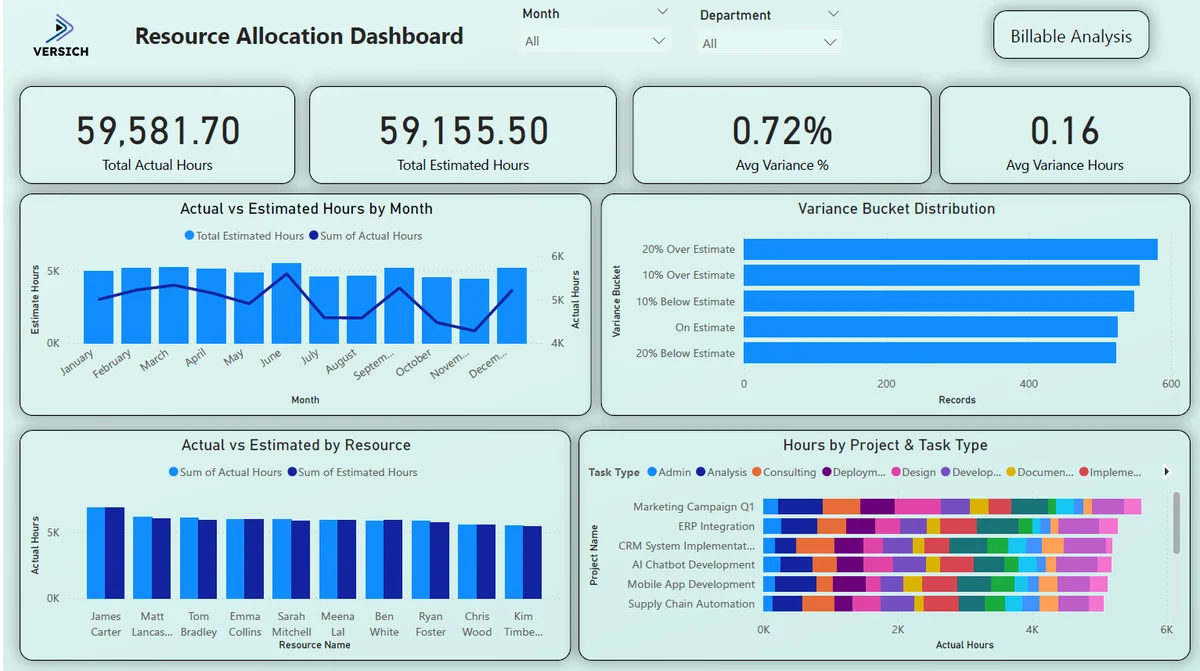
Resource Allocation Dashboard
Power BI Resource Allocation Dashboard provides insights into actual vs estimated hours, billable vs non-billable time, variance, and department utilization helping teams optimize capacity, improve planning, and drive profitability.
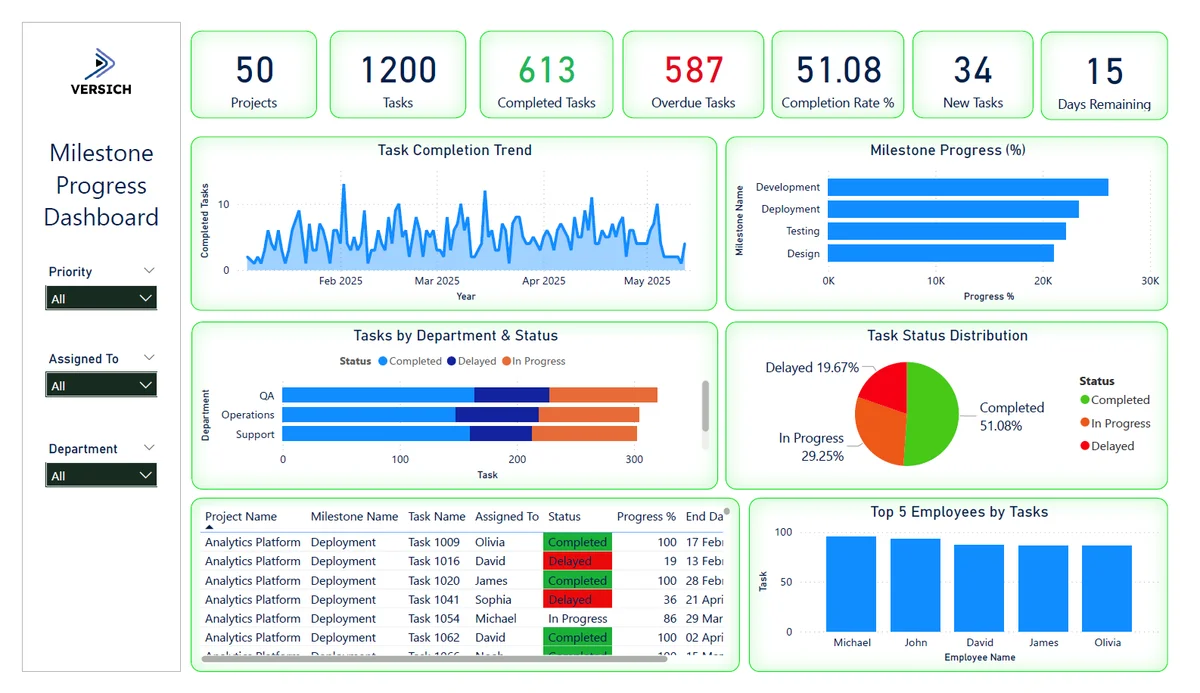
Milestone Progress Dashboard
The Milestone Progress Dashboard in Power BI provides insights into task completion trends, milestone progress, department performance, and employee productivity, helping teams make data-driven decisions to ensure timely project delivery and address
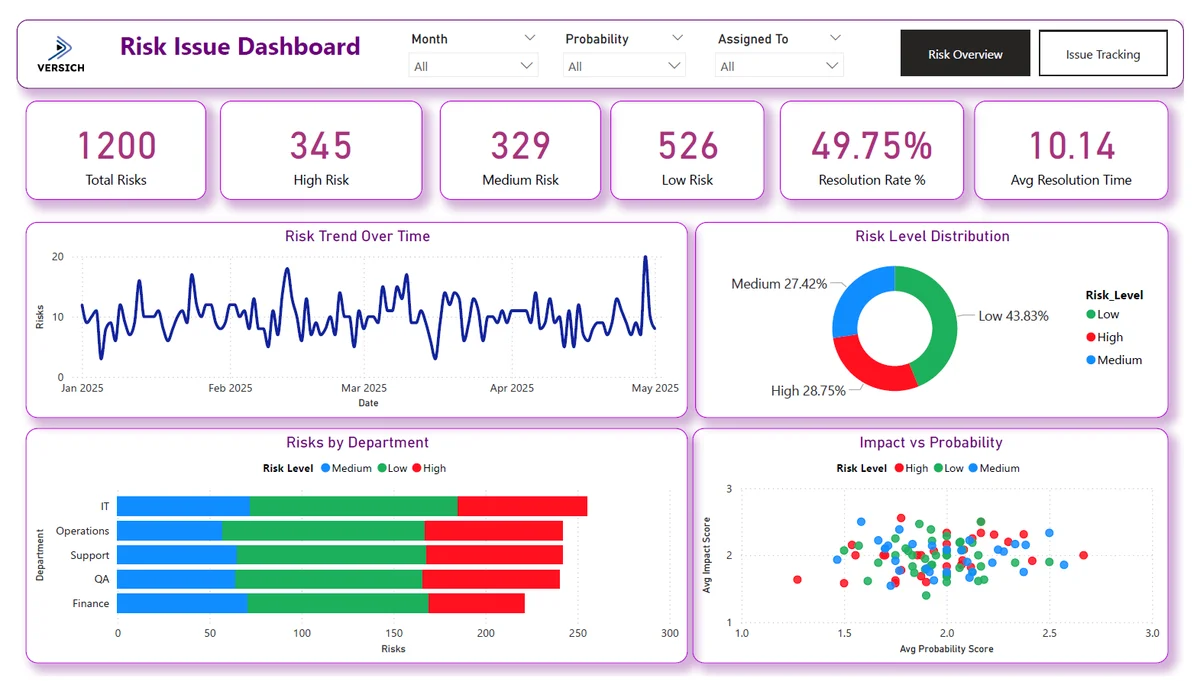
Risk and Issue Dashboard
The Risk Issue Dashboard in Power BI offers insights on risk levels, issue tracking, overdue trends, and resolution performance, enabling proactive, data-driven actions for faster issue resolution and risk management.
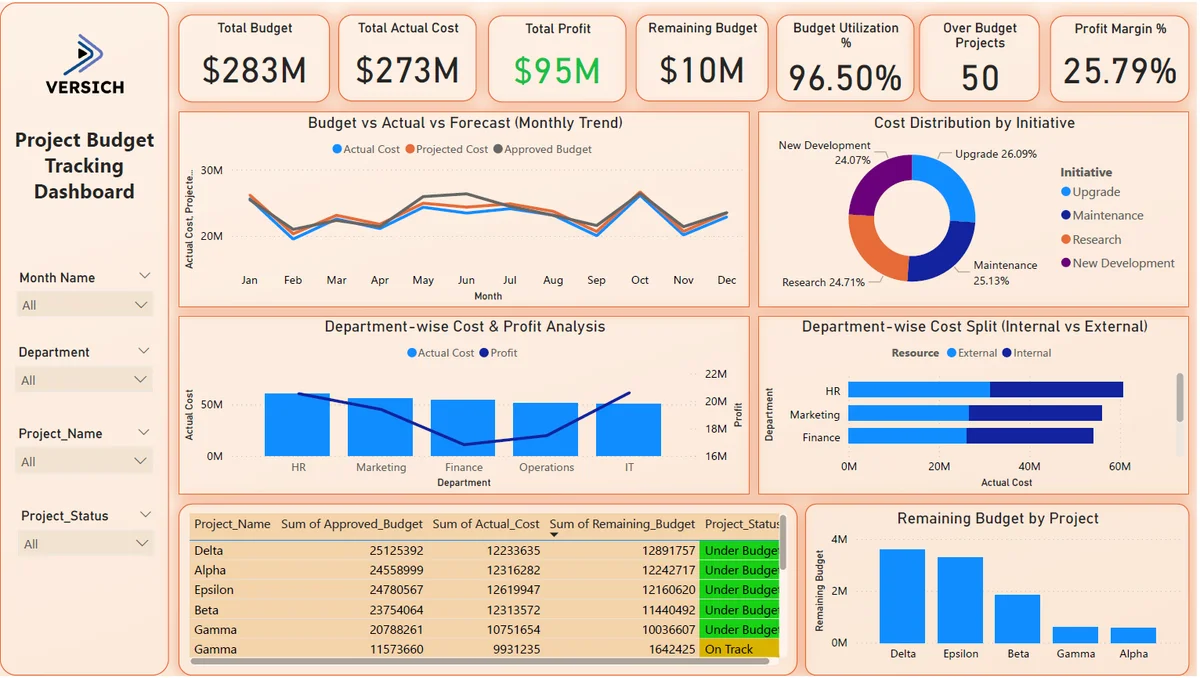
Project Budget Tracking Dashboard
The Project Budget Tracking Dashboard in Power BI provides insights into budget usage, actual vs forecast costs, department profitability, and remaining project budgets, helping finance and project teams improve cost control and budget management.
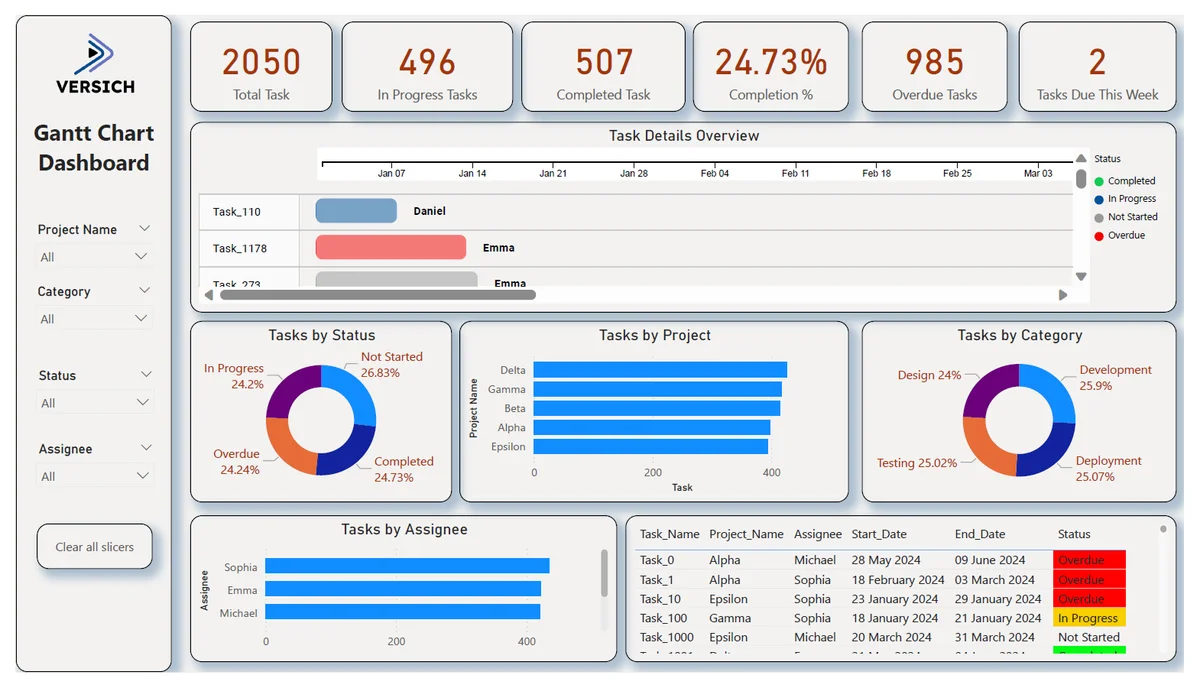
Gantt Chart Dashboard
Power BI Gantt Chart Dashboard provides insights into task timelines, project distribution, workloads, and categories, helping teams manage schedules, detect delays, and ensure on-time project delivery.
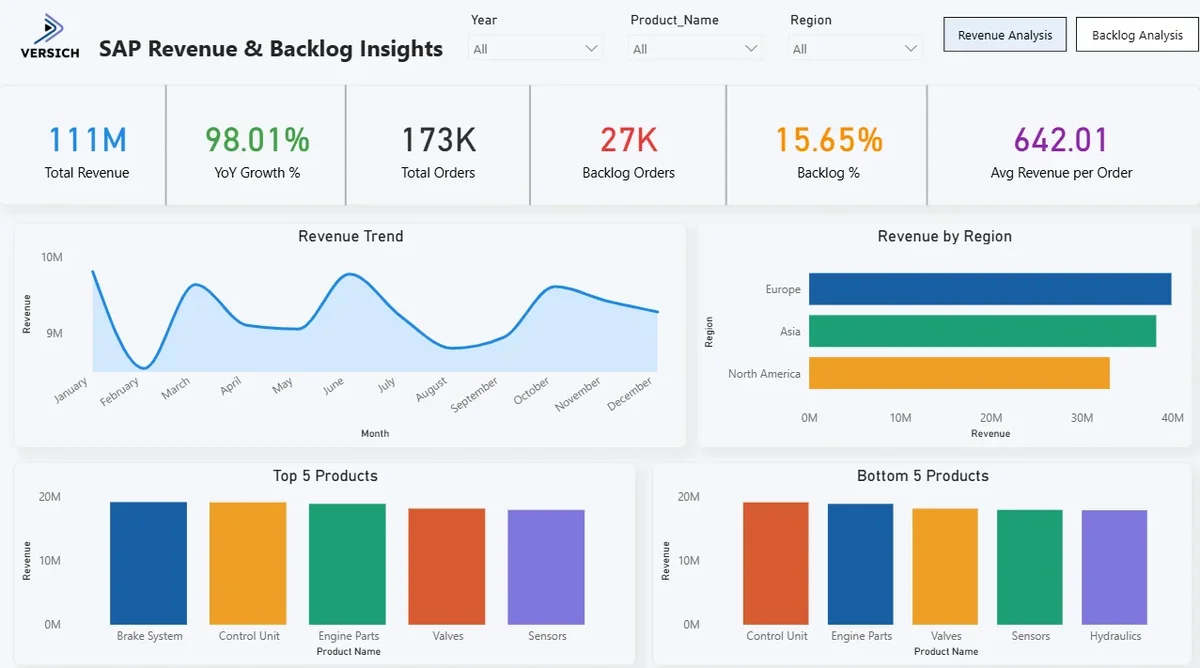
SAP Revenue & Backlog Insights
The SAP Revenue & Backlog Insights Power BI project delivers insights into revenue trends, backlog patterns, regional performance, and product analysis, helping sales and operations teams drive growth, reduce backlog, and optimize product portfolios.
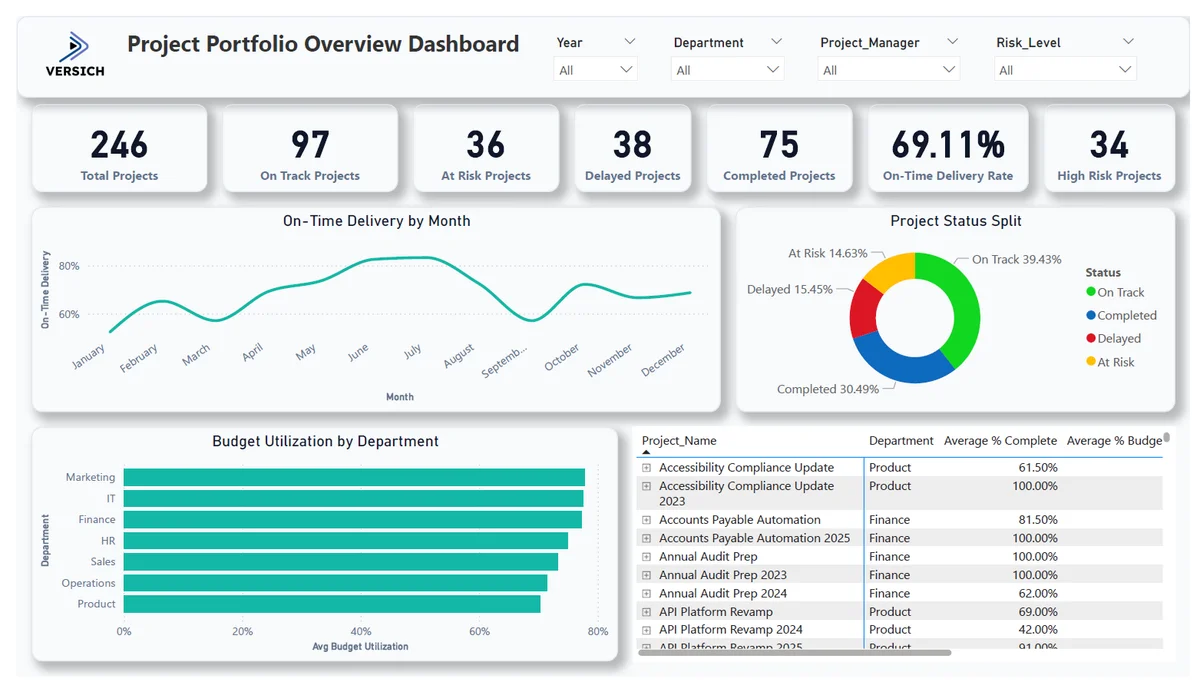
Project Portfolio Overview Dashboard
A Power BI dashboard giving PMOs and leadership real-time visibility into portfolio health tracking 246 projects across status, delivery timelines, and budgets. It highlights on-time delivery trends, risk concentration, and department-wise budget uti
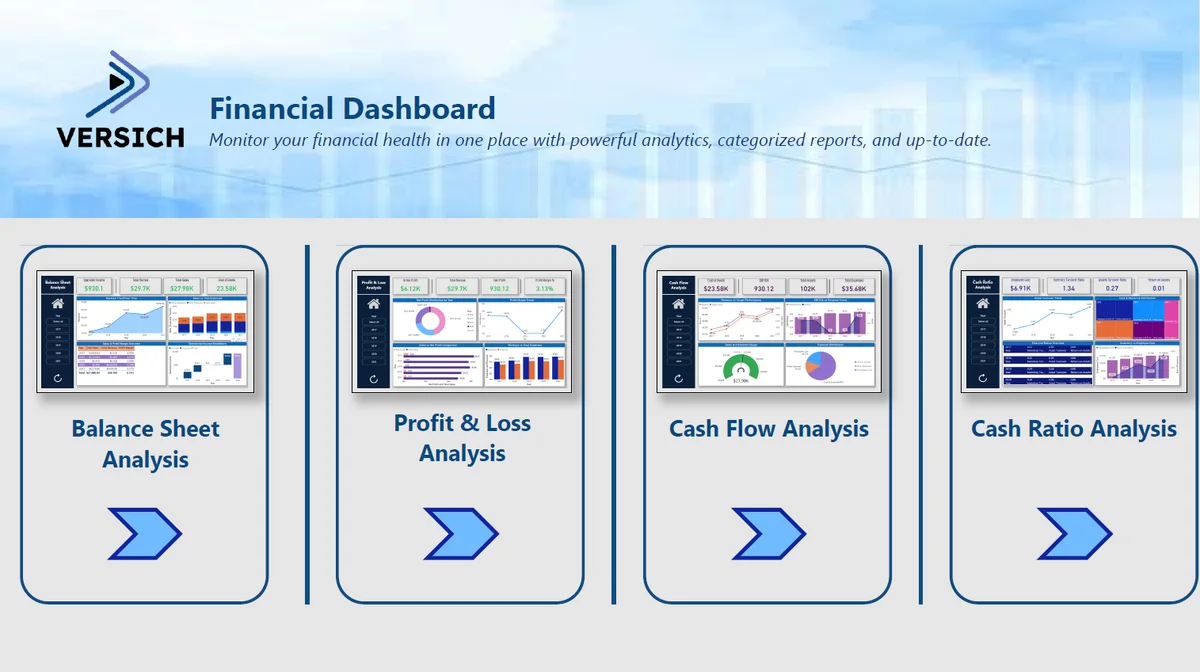
Financial Dashboard
The Financial Dashboard Power BI project delivers advanced insights into balance sheet performance, profit and loss trends, cash flow health, and financial ratio analysis, empowering finance teams and leadership with actionable intelligence for profi
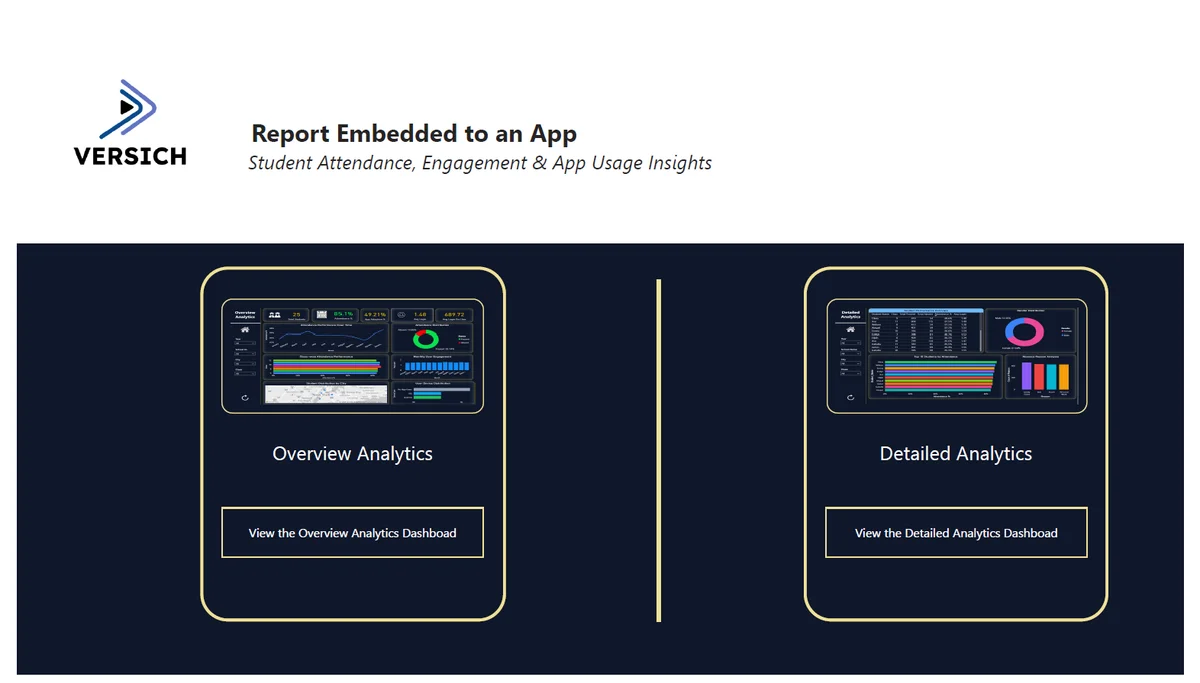
Student Attendance, Engagement & App Usage Insights
The Student Attendance, Engagement & App Usage Insights Power BI project delivers advanced insights into student attendance patterns, class-wise performance, app adoption, user engagement, and detailed absence analysis, empowering school administrato