Introduction
Project-based organisations generate a large volume of operational and financial data every day. Project plans contain tasks, milestones, owners, and dependencies. Timesheet systems record employee effort. Professional Services Automation platforms hold resource allocations, billing rules, and project economics. ERP systems manage invoices, costs, revenue recognition, and the general ledger. CRM platforms contain the pipeline and client relationship. The problem is that these systems rarely present a connected view of performance. That fragmentation makes seemingly simple questions difficult to answer.
Which projects are likely to exceed budget?
Is utilisation improving or declining?
How much work has been delivered but not billed?
Which clients generate revenue but consume too much delivery capacity?
Are project managers using the same definition of completion, margin, and forecast?
When the answers depend on manual exports and spreadsheet reconciliation, management reporting becomes slow, inconsistent, and backward-looking.
Power BI gives project management and PSA organisations a governed analytics layer across these systems. It can bring together project delivery, resource, time, expense, billing, revenue, and client data, then present it through interactive dashboards for executives, finance teams, project managers, resource managers, and delivery leaders. The value is not simply better charts. The real value is a repeatable reporting model that connects delivery activity to commercial outcomes.
In this blog, we explain how Power BI supports project-based organisations, the dashboards and KPIs that matter, how common PSA and project management systems can be integrated, and the implementation practices required to create reliable reporting at scale.
What Is Power BI for Project Management?
Power BI for project management is the use of Microsoft Power BI to consolidate, model, and visualise information about projects, programmes, resources, and portfolios. It gives stakeholders a controlled way to monitor planned work, actual progress, cost, revenue, capacity, risk, and forecast performance without relying on separate reports from every source system.
Power BI does not replace a project management or PSA platform. Operational users still need tools where they can create tasks, assign resources, submit timesheets, approve expenses, raise invoices, and update project status. Power BI sits above those processes as the analytical layer. It standardises the calculations, connects records across systems, and makes information easier to explore.
A project manager may use a Power BI report to identify overdue milestones, compare actual hours with estimates, and review remaining budget. A finance business partner may use the same semantic model to analyse work in progress, unbilled revenue, recognised revenue, and margin. A resource manager may focus on capacity, allocation, and future demand. Leadership can move from a portfolio overview into the details behind a project that is at risk.
What Is a PSA Organisation?
PSA stands for Professional Services Automation. A PSA organisation is a project-based business that sells expertise, time, outcomes or managed services and uses technology to coordinate the commercial and operational lifecycle of that work. PSA systems typically support opportunity handover, project setup, resource planning, time and expense capture, billing, revenue forecasting, and performance reporting.
Consulting firms, IT services companies, accounting and advisory practices, engineering businesses, marketing agencies, architecture firms, managed service providers, legal organisations, and other professional services businesses all operate with variations of the same economic model. They must convert available employee capacity into high-quality client delivery while protecting margin and maintaining a predictable revenue pipeline.
That creates a different reporting requirement from product-led businesses. Inventory may not be the main constraint. Skilled people, billable capacity, delivery timing and contract terms are often the critical drivers. A PSA organisation, therefore, needs to understand not only how much revenue it has earned, but also which resources produced it, how much effort was required, whether the engagement is within scope, what remains to be billed, and whether future demand can be staffed.
Why Project-Based Organisations Need Better Analytics
Project-based organisations often begin with spreadsheets because they are flexible and familiar. A team can quickly create a project tracker, budget file or utilisation report. The difficulty appears when the organisation grows. Different departments create their own definitions, files are copied into multiple locations, formulas change without governance and historic versions become difficult to reproduce.
The reporting challenge is also structural. Delivery data may live in a project platform, employee data in an HR system, revenue and cost in an ERP platform, opportunities in a CRM and forecasts in a planning application. Even when each system has reports, the native reports usually reflect only the data held in that application. This limits the organisation's ability to analyse the entire project lifecycle.
Poor visibility creates several risks. Project overruns may be recognised only after the budget is largely consumed. Resource shortages may become visible when delivery commitments are already fixed. Missing timesheets delay billing and distort utilisation. Fixed-fee projects may look commercially successful until the actual labour cost is included. Forecasts may rely on optimistic project dates that are not connected to milestone progress or resource availability.
Better analytics should therefore do more than report historical totals. It should expose exceptions, show the relationship between operational activity and financial performance, preserve historical snapshots, and make the assumptions behind forecasts visible. Power BI is well-suited to this requirement because it can combine multiple data sources, apply reusable calculations, and deliver different report experiences from the same governed model.
How Power BI Supports Project Management and PSA Reporting
Power BI supports project management and PSA reporting through a combination of data connectivity, transformation, modelling, calculation and distribution. Data can be collected from APIs, databases, OData feeds, files, cloud applications, and data warehouses. Power Query can standardise formats and business rules. A semantic model can then connect projects, tasks, resources, time entries, costs, invoices, clients, and calendar periods.
Once that model is established, DAX measures provide consistent definitions for metrics such as budget variance, billable utilisation, gross margin, backlog and estimate at completion. Those measures can be reused across projects, finance, and executive reports, reducing the risk that every dashboard calculates performance differently.
Power BI also supports drill-through and cross-filtering. An executive can select a service line, region or project status and immediately see the effect across revenue, margin, utilisation, and delivery views. A project manager can move from a high-level variance to the employees, tasks or transactions that created it. Alerts, subscriptions and mobile access can help keep performance information within regular management routines.
For larger environments, Microsoft Fabric, Azure Data Factory, or an existing data warehouse can be used to orchestrate extraction and retain historical data before it reaches Power BI. This creates a more scalable pattern for combining PSA, ERP, CRM, and workforce data, while reducing repeated direct queries against operational systems.
Key Benefits of Power BI for PSA Organisations
Centralised Project Reporting
Power BI creates a common reporting layer across projects, resources, clients and finance. Instead of preparing separate spreadsheets for delivery, utilisation and commercial performance, teams can work from the same underlying model. This improves consistency and reduces reconciliation effort.
Real-Time Project Visibility
Scheduled or near real-time refresh gives managers earlier visibility into milestone delays, budget consumption, missing time, blocked work and other exceptions. The refresh frequency should match the decision being made. Operational dashboards may need more frequent updates than month-end profitability reports.
Improved Resource Utilisation
Resource dashboards show the relationship between capacity, allocation, actual effort, and billable activity. This helps managers identify overallocated employees, available specialists, bench time, and future capacity gaps before they affect delivery or margin.
Better Project Profitability Analysis
Power BI can combine contract value, recognised revenue, invoiced revenue, labour cost, external cost, and expenses. This creates a more complete view of project and client profitability than delivery progress alone.
More Accurate Forecasting
Forecasts become stronger when they use backlog, project plans, staffing schedules, billing rules, and historical delivery patterns. Power BI can compare the current forecast with previous versions, so leadership can understand both the latest outlook and the movement behind it.
Faster Management Reporting
Automated refresh and reusable measures reduce the time spent extracting, combining, and formatting information. Finance and PMO teams can focus more on analysis and corrective action instead of rebuilding the same report each week or month.
Better Decision-Making
Role-based reports give stakeholders the level of detail they need. Executives receive a portfolio view, project managers see operational exceptions, finance teams see project economics, and resource managers see capacity and demand. Everyone works from the same set of governed definitions.
Power BI Dashboards for Project Management Organisations
A useful dashboard should answer a defined set of business questions, not simply display every field available from the source system. The following dashboards cover the most common reporting needs across project-based and professional services organisations.
1. Project Resource Allocation Dashboard
A project resource allocation dashboard connects planned hours, actual hours, billable time, non-billable time, capacity and department utilisation. It helps resource and delivery managers understand whether the workforce is being used effectively and whether actual effort is tracking against the assumptions used during planning.
Useful visuals include estimated versus actual hours by project, utilisation by department, allocation by employee, billable percentage, variance hours and a forward-looking capacity view. The dashboard should make it easy to separate productive non-billable activities, such as training or internal initiatives, from unplanned bench time.
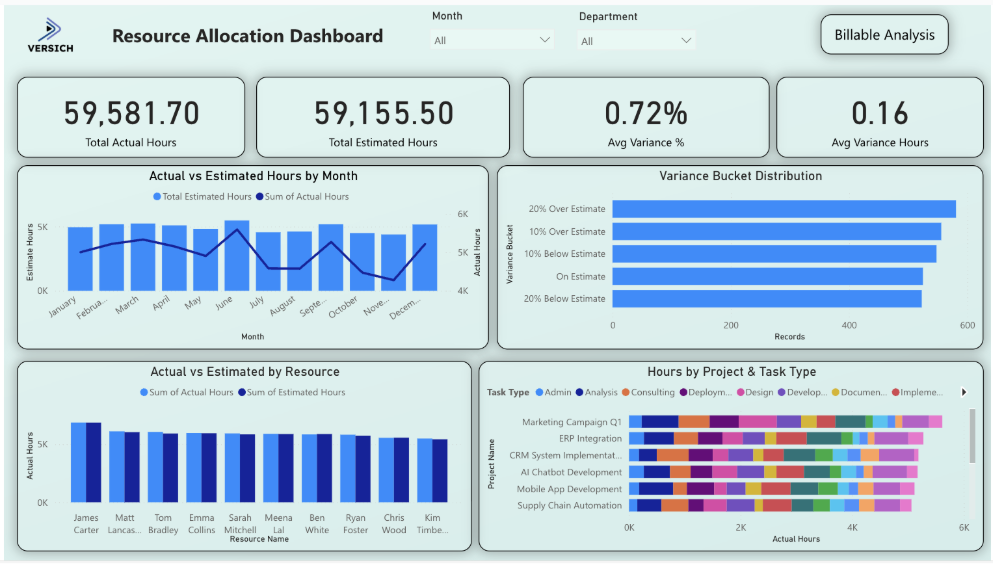
Explore our interactive Power BI Resource Allocation Dashboard to see how these measures can be presented in a practical management view.
2. Project Milestone Progress Dashboard
A milestone progress dashboard focuses on project execution. It shows milestone status, task completion trends, overdue work, completion rates, department performance and employee productivity. It should highlight items that need attention rather than forcing users to inspect every task.
The strongest milestone dashboards use consistent status logic. For example, a milestone can be classified as on track, at risk, overdue or completed based on planned date, actual date, percentage complete, and dependency status. Historical trend data is also valuable because a current status alone does not show whether performance is improving or deteriorating.
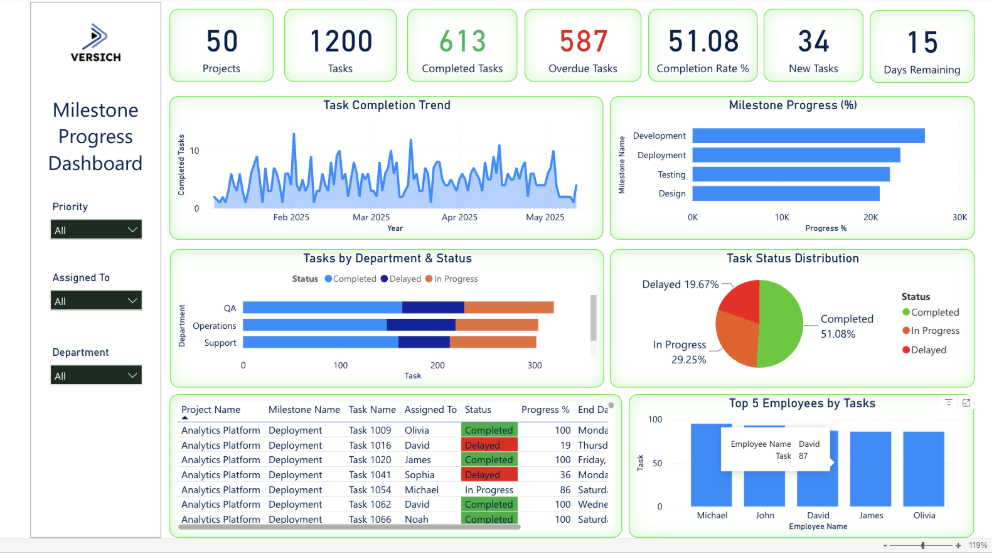
Explore our interactive Project Milestone Progress Dashboard for an example of task and milestone reporting in Power BI.
3. Project Budget Tracking Dashboard
A project budget tracking dashboard brings together the approved budget, revised budget, actual cost, forecast cost, remaining budget, profit, and utilisation of budget. It enables project and finance teams to see which initiatives are within plan and which require intervention.
The dashboard should distinguish actual cost from committed cost and forecast cost. Actual cost explains what has already happened. Committed cost identifies approved spending that has not yet been posted. Forecast cost estimates the full expected outcome. Combining those measures gives a more useful view than comparing the budget with the actual cost alone.
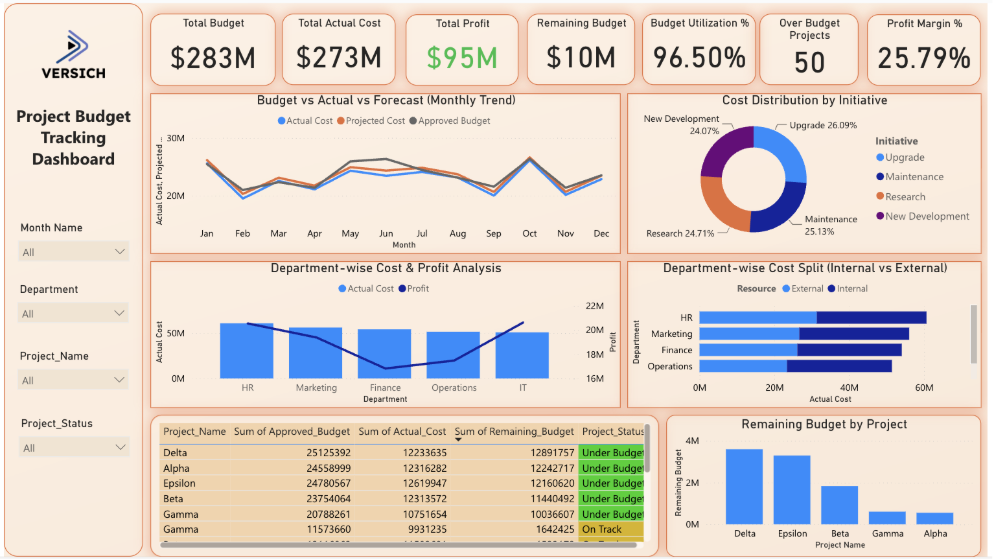
Explore our interactive Project Budget Tracking Dashboard to review a practical approach to budget, cost, and profitability reporting.
4. Project Portfolio Dashboard
A project portfolio dashboard gives leadership a consolidated view across all active projects. Core measures may include the number of active projects, projects by status, portfolio budget, actual project cost, completion percentage, projects at risk, upcoming milestones, portfolio revenue, and margin.
The dashboard should support drill-down by business unit, geography, client, service line, project manager, and contract type. It should also make portfolio concentration visible. For example, leadership may need to know whether a large proportion of the expected margin depends on a small number of projects or clients.
5. Project Financial Dashboard
A project financial dashboard connects project operations to accounting outcomes. It can include contract value, budgeted revenue, recognised revenue, invoiced revenue, project cost, gross profit, gross margin, work in progress, and unbilled revenue.
Reconciliation is essential. The dashboard should make clear whether values come from project transactions, subledgers, revenue schedules or the general ledger. Where operational and accounting timing differ, the report should explain the difference instead of presenting apparently conflicting totals. This is particularly important for fixed-fee contracts, multi-currency projects, and revenue recognition arrangements.
6. Project Time and Expense Dashboard
A time and expense dashboard helps organisations manage the inputs that drive utilisation, billing, and cost. It can show submitted hours, approved hours, billable hours, non-billable hours, missing timesheets, project expenses, expense categories, and time-entry compliance.
Compliance reporting should be actionable. Managers should be able to identify the employees, projects, and periods behind missing or late submissions. The dashboard can also display the downstream impact, such as delayed billing due to unapproved time or understated project profitability resulting from unrecorded employee effort.
Important Project Management and PSA KPIs
KPIs should be selected based on the decisions the organisation needs to make. A large catalogue of metrics does not automatically create insight. The most valuable measures are clearly defined, consistently calculated, and linked to an owner who can take action when performance deviates from an agreed-upon threshold.
KPI Category | Recommended Measures |
Project delivery KPIs | Project completion percentage; on-time delivery rate; schedule variance; milestone completion rate; overdue tasks; project health score; risk exposure; change request volume. |
Financial KPIs | Project revenue, project cost, gross profit, gross margin percentage, budget variance, cost variance, revenue variance, estimate at completion, work in progress, and unbilled revenue. |
Resource KPIs | Billable utilisation rate; productive utilisation rate; resource availability; capacity utilisation; allocation percentage; bench time; revenue per employee; average billable rate. |
Commercial KPIs | Project pipeline value, project win rate, backlog, revenue forecast, client profitability, project profitability, average project value, contract renewal rate. |
How to Interpret the KPI Groups
Delivery KPIs explain whether work is progressing to plan. Financial KPIs explain the economic result. Resource KPIs show whether the organisation has the capacity and utilisation needed to deliver that result. Commercial KPIs connect current delivery with future demand and client value.
These groups should be analysed together. A high utilisation rate may look positive, but it can conceal sustained overtime or over-allocation. A project may show a strong gross margin while carrying a large unbilled balance. A healthy backlog may create risk if the resource plan shows insufficient capacity. Power BI enables these relationships to be explored through one model rather than isolated scorecards.
Definitions must also be explicit. Billable utilisation can be calculated using available hours, contracted hours or productive hours as the denominator. Project completion can be based on tasks, milestones, effort or financial value. Backlog can include signed contracts only or also a weighted pipeline. Governance over these definitions is more important than the visual design of the KPI card.
Connecting Power BI to PSA and Project Management Systems
The right integration method depends on the source platform, data volume, refresh requirement, security model, and whether historical snapshots are needed. Small implementations may connect Power BI directly to an API, OData feed or cloud connector. Larger environments usually benefit from an intermediate data platform where data can be validated, combined and retained before reporting.
A common architecture uses an extraction layer, a staging or warehouse layer, a governed semantic model, and separate reports for different user groups. This prevents each report from creating its own connection and business logic. It also makes it easier to manage API limits, incremental loads, source system changes, and audit requirements.
NetSuite
NetSuite can be connected to Power BI through several methods. SuiteAnalytics Connect provides ODBC, JDBC, and ADO.NET connectivity for analytical access to NetSuite data. Power BI Desktop can connect through an ODBC data source, while an enterprise architecture may extract the same data into SQL Server, Azure SQL, a lakehouse or another warehouse before it reaches Power BI.
NetSuite REST and SuiteTalk services can also be used when the organisation needs controlled API extraction or access to records not suited to the Connect schema.
Integration platforms such as Celigo, Boomi, or MuleSoft can orchestrate the movement of NetSuite data into a reporting destination. The preferred approach depends on data volume, latency, custom records, governance, and licensing.
For project reporting, the model normally combines projects, project tasks, employees, time entries, expense reports, sales orders, invoices, revenue arrangements and general ledger transactions. Careful mapping is required for subsidiaries, currencies, accounting periods, and project status.
Explore our NetSuite and Power BI integration services for implementation support.
Dynamics 365 Project Operations
Dynamics 365 Project Operations data is built around Microsoft Dataverse and finance and operations capabilities. Power BI can connect to Dataverse using the Dataverse connector, while Microsoft Fabric Data Factory or Azure Data Factory can be used to move data into a scalable analytical platform.
The reporting model may include opportunities, quotes, contracts, projects, project tasks, resource assignments, time entries, expenses, actuals, and invoices. Organisations should decide whether Power BI will report directly from Dataverse for a focused use case or from a curated warehouse that also includes finance, HR, and CRM data. The second pattern is generally stronger when reporting spans multiple Dynamics 365 applications or requires long-term historical snapshots.
Certinia
Certinia PSA operates on the Salesforce platform, so Power BI can access its data through the Salesforce Objects connector when API access is enabled. This allows the model to retrieve Certinia custom objects alongside standard Salesforce accounts, opportunities, and users.
For larger data volumes, the Salesforce Bulk API, Microsoft Fabric Data Factory, or a third-party extraction tool can load the required objects into a warehouse. This approach can reduce repeated API calls and make it easier to combine PSA data with ERP actuals. The model should map projects, assignments, timecards, milestones, billing events, resources, regions, practices, and groups using stable Salesforce record identifiers.
Kantata
Kantata can provide data through APIs and scheduled exports. Kantata's Scheduled Data Exporter can automate the delivery of standard or custom report data to external BI tools, warehouses, or storage services such as FTP and Amazon S3. Power BI can then consume the staged files or the database into which they are loaded.
This pattern works well when the organisation wants a predictable, scheduled refresh and does not need Power BI to query the operational application directly. API-based extraction can provide more control over raw project, task, time, and resource data. The integration should account for pagination, custom fields, deleted records, and the relationship between scheduled hours, actual hours, fees, and project status.
BigTime
BigTime Data Hub provides an analytics-oriented method for accessing BigTime and resource management datasets from Power BI and other tools. Where Data Hub is available, it can simplify data discovery and support frequent refreshes. BigTime APIs can also be used for tailored extraction into a warehouse or lakehouse.
The reporting model may include staff, clients, projects, timesheets, expenses, invoices, budgets, rate cards, and resource schedules. Access should be designed carefully because analytical credentials may expose a broad range of data. Sensitive employee costs and client information should be restricted within the data platform and Power BI model.
Deltek
Deltek integration depends on the specific product. Deltek VantagePoint exposes API authorisation for application access. Deltek Maconomy can support ODBC connectivity when the relevant add-on is configured. Costpoint has its own reporting and business intelligence capabilities, but organisations may still extract curated data into a warehouse when they need to combine Deltek with CRM, HR or enterprise finance information in Power BI.
The integration design should therefore begin with the exact Deltek product, deployment model, and licensed interfaces. Direct database access may be appropriate in some on-premises environments, while cloud deployments may require APIs, scheduled exports, or vendor-supported data services. The model must preserve project, organisation, employee, and account structures used in Deltek.
Microsoft Project
Microsoft Project Online can be connected to Power BI through its OData feed, and Microsoft has provided a Project Web App template for project, portfolio, and resource analysis. Project for the web stores its data in Dataverse, which allows Power BI Desktop to connect through the Dataverse connector.
The correct method depends on which Microsoft Project product the organisation uses. For Project Online, the OData endpoint exposes projects, tasks, assignments, and related entities. For Dataverse-based project experiences, the model uses the relevant project and task tables. In both cases, the data should be joined to finance and resource systems if the organisation needs full profitability and utilisation reporting.
Microsoft Planner
Microsoft Planner reporting requires different treatment for basic and premium plans. Premium project capabilities that originated from Project for the web store data in Dataverse, which can be accessed through Power BI. Basic Planner task data is commonly extracted through Microsoft Graph or Power Automate into SharePoint, Dataverse, SQL, or another reporting store.
A staged approach is usually preferable when reporting across many plans because it provides a stable history of task status, assignments, and due dates. The model should retain plan, bucket, task, assignee, status, priority and date information, while respecting Microsoft 365 permissions and any limitations of the source API.
Jira
Jira Cloud provides REST APIs for platform and software data, including issues, projects, boards, epics, and sprints. Power BI can call the REST API through Power Query for a controlled use case, but larger implementations should usually use Fabric, Azure Data Factory, or another ETL tool to manage authentication, pagination, rate limits, and incremental loading.
A Jira model often needs issue status history rather than only the current status. Without history, the organisation cannot reliably calculate cycle time, time in status or changes to sprint scope. The extraction process should therefore preserve changelog or snapshot data where these measures are required.
Asana
Asana provides a REST API that can expose projects, tasks, sections, users, teams, custom fields, and status information. Power BI can access the API directly for smaller models, while an intermediate warehouse is better for broad enterprise reporting.
The integration should handle pagination, nested task relationships, custom fields, and the fact that a task can belong to more than one project. Historical snapshots are useful when the organisation wants to analyse changes in status, due dates, or workload over time rather than only the current state.
monday.com
Monday.com exposes a GraphQL platform API. An integration can query boards, items, groups, columns, users, and updates, then load the results into Power BI or a staging platform. GraphQL is flexible, but the extraction design must control query complexity, pagination, and API usage.
Because monday.com boards are highly configurable, a reporting model should standardise the column definitions used across teams. Without common fields for project, owner, status, budget, and dates, enterprise reporting becomes difficult even when the API connection is technically successful.
Smartsheet
Smartsheet provides an API for sheets, rows, columns, users, and related resources. Data can be extracted through the API, scheduled exports, or connectors and then modelled in Power BI. The integration should preserve sheet identifiers and column identifiers because displayed names can change.
Organisations that use multiple sheets for similar project processes should establish a standard template. A consistent structure makes it possible to append data across projects and create a portfolio model. Where sheets vary significantly, a mapping layer is needed to convert local column names into common reporting fields.
Excel and SharePoint
Excel and SharePoint remain common sources for project registers, risk logs, budgets, and manual forecasts. Power BI can connect to files stored in SharePoint or OneDrive and combine multiple files from a controlled folder. SharePoint lists can also be used for structured project data.
These sources work best when templates, column names, data types, and ownership are governed. A folder full of differently structured spreadsheets will create a fragile reporting process. For critical reporting, Excel should be treated as a controlled input with validation rules, not an unrestricted alternative to a transactional system.
Power BI Versus Native PSA Reporting
Native PSA reports are valuable for day-to-day operational questions inside the application. They usually respect the source system's security and can be easier to deploy for standard use cases. Power BI becomes more valuable when the organisation needs cross-system analysis, customised calculations, richer visualisation or a common executive reporting layer.
Capability | Native PSA Reporting | Power BI |
| Primarily, data is held in the PSA platform. | Combines PSA, ERP, CRM, HR, planning, and external data. |
| Strong for standard operational reports, but may have design limits. | Highly configurable pages, calculations, navigation, and visual design. |
| Often requires separate integrations or exports. | Designed to model relationships across multiple systems. |
| Depends on product-specific formula capability. | DAX supports reusable measures, time intelligence and scenario logic. |
| Usually, within the source application structure. | Portfolio-to-project-to-transaction drill-through across sources. |
| May require custom reports or exports. | Supports tailored executive apps, mobile views, and subscriptions. |
| Scales within the boundaries of the PSA reporting engine. | Can use Fabric, data warehouses, incremental refresh, and shared semantic models. |
| Users work within PSA report tools and available fields. | Governed datasets can support wider self-service exploration. |
The best approach is often complementary. Operational teams use native PSA reporting for immediate workflow questions, while Power BI provides cross-platform management reporting and deeper analytical models. The implementation should avoid rebuilding every native screen in Power BI. It should focus on questions that require consolidation, trend analysis, forecasting, or flexible drill-down.
Power BI Implementation Approach for Project-Based Organisations
1. Define Business Questions
Begin with the decisions each dashboard must support. Examples include identifying projects likely to exceed budget, determining whether future demand can be staffed, reducing unbilled revenue, and improving forecast accuracy. This keeps the implementation focused on measurable value.
2. Agree on KPI Definitions
Document the calculation, source, frequency, owner, and target for each KPI. Utilisation, backlog, project margin, and completion percentage often have several valid definitions. The agreement prevents disputes after the dashboards are built.
3. Review Data Sources
Assess the availability, quality, granularity, retention, and ownership of data in each source. Confirm how records can be extracted, how often they change and which identifiers can connect them. Identify custom fields and local workarounds early.
4. Design the Data Model
Create a model that connects projects, tasks, resources, time entries, expenses, invoices, costs, clients, and calendar periods. Use a star schema where practical and separate reusable dimensions from transactional facts. Plan for multiple currencies, legal entities, and contract types.
5. Build a Minimum Viable Dashboard
Start with the dashboards that address the highest-value decisions. A project's health, resource utilisation, and project financial view often provide a strong first release. Avoid trying to deliver every possible report at once.
6. Validate the Numbers
Reconcile Power BI with source reports and, where financial data is involved, the ERP subledger or general ledger. Test totals and detailed transactions. Document expected timing differences so users understand why two systems may not update simultaneously.
7. Deploy and Train Users
Publish reports through controlled workspaces and apps. Provide different experiences for executives, finance, project managers, and resource managers. Training should explain the business meaning of the metrics, not only how to click filters.
8. Continuously Improve Reporting
Review adoption, performance, data quality incidents, and changing business requirements. Add new measures only when ownership and value are clear. Retire unused reports and maintain a change process for KPI definitions.
Power BI Data Governance and Security
Project and PSA reporting often contains sensitive information, including employee cost rates, client pricing, contract values, utilisation, performance, and forecast assumptions. Security must be designed into the data model and distribution process.
Row-level security can restrict users to the projects, business units, regions, or clients they are authorised to see. Object-level security can hide sensitive tables or columns from specific user groups. Workspace access should distinguish between administrators, developers, contributors, and consumers. Where external clients receive reports, embedded or business-to-business access should be designed separately from internal management reporting.
Data ownership is equally important. Each domain should have a named owner responsible for source quality and business definitions. KPI governance should specify who can approve changes to calculations. Certified or promoted semantic models can help users identify trusted data products.
Refresh monitoring, failure alerts, and lineage documentation support operational reliability. Development, testing, and production environments reduce the risk of untested changes reaching management reports. Deployment pipelines or a controlled release process should be used for models that influence financial or commercial decisions.
Auditability requires the organisation to retain the logic behind reported numbers. This includes source mappings, transformation rules, DAX measures, and refresh history. Where forecasts or status values change over time, snapshots should be retained so users can compare what was known at different reporting dates.
Common Power BI Reporting Mistakes to Avoid
Building dashboards before defining business questions
This creates attractive reports that do not support a specific decision or management process.
Using inconsistent KPI calculations
Different definitions of margin, utilisation, or completion undermine trust and create reconciliation work.
Reporting directly from poor-quality source data
Power BI can expose data quality issues, but it cannot make unreliable source processes reliable without governance and remediation.
Creating too many visuals
Dense pages make it difficult to identify the exception or action that matters. Each visual should have a purpose.
Ignoring historical project snapshots
Current-state data cannot explain how status, forecast, scope or due dates changed over time.
Mixing operational and financial definitions
Project system cost and accounting cost may follow different timing and inclusion rules. The report should distinguish them.
Failing to reconcile with the general ledger
Financial dashboards need a documented reconciliation process, particularly for revenue, cost, WIP, and unbilled balances.
Using one dashboard for every audience
Executives, project managers, finance teams, and resource managers need different levels of detail and emphasis.
Ignoring report performance
Poor models, excessive visuals, and inefficient DAX reduce adoption. Performance testing should be part of delivery.
Failing to establish report ownership
Without an owner, data issues remain unresolved, definitions drift, and reports become outdated.
Why Versich for Power BI and PSA Implementation
Strong Industry Experience
We understand that project reporting is not only a dashboard exercise. The model must reflect how projects are sold, staffed, delivered, billed and recognised in finance. Our work connects operational reporting with the commercial and accounting processes that determine project performance.
Cross-Platform Expertise
Our team works across Power BI, NetSuite, Salesforce, integration platforms, cloud data services and wider finance transformation. This allows us to address the source data and integration challenges behind the dashboard rather than treating Power BI as an isolated tool.
Practical Project Portfolio
We build interactive dashboards for resource allocation, project budgets, milestones, task status, risk, finance and executive reporting. Our portfolio demonstrates how raw project and financial data can be converted into views that support real management decisions.
Explore our Power BI dashboard portfolio to review examples of our reporting work.
Global Reach
We support organisations across regions and time zones, including businesses with multiple entities, currencies, reporting requirements, and delivery models. Our approach can scale from a focused dashboard implementation to an enterprise reporting architecture.
Power BI Use Cases by Professional Services Industry
Consulting Firms
Consulting businesses can analyse engagement margin, consultant utilisation, backlog, pipeline conversion, rate realisation, and revenue forecast. Power BI can also compare delivery by client, practice, region, and project manager.
IT Services and Managed Service Providers
IT services organisations can connect project delivery with support tickets, service contracts, technical resource capacity, and recurring revenue. Dashboards can highlight project overruns, SLA performance, deployment milestones, and skill shortages.
Engineering and Construction Consultancies
Engineering consultancies can monitor project budgets, milestones, labour costs, subcontractor costs, committed spend, and estimate at completion. Portfolio reporting can show exposure by discipline, location, client, and project phase.
Marketing and Creative Agencies
Agencies can analyse campaign profitability, team utilisation, retainers, client budgets, scope changes and delivery capacity. This helps identify clients or service lines that generate revenue but consistently require unplanned effort.
Accounting and Advisory Firms
Accounting and advisory organisations can report engagement profitability, billable hours, work in progress, write-offs, collections and client performance. Resource dashboards can support seasonal capacity planning and partner-level review.
Legal Services Organisations
Legal organisations can analyse matter profitability, billable utilisation, rates, expenses, WIP, collections, and client concentration. Security rules are particularly important because the matter and client confidentiality must be preserved.
Best Practices for Designing Project Management Dashboards
Good dashboard design begins with the user and the action the user needs to take. The following practices help turn a collection of visuals into a reliable management tool.
Design reports for specific user roles rather than creating one page for every audience.
Prioritise exceptions and actions, such as projects over budget, milestones overdue, or resources overallocated.
Use consistent status indicators and define the rules behind each status.
Provide drill-through from portfolio to project, resource, task or transaction detail.
Display targets or budgets beside actual results so users can interpret performance immediately.
Include historical trends and prior forecasts, not only current totals.
Make filters easy to understand and show which filters are currently active.
Limit unnecessary visuals and avoid repeating the same measure in several formats.
Include data freshness information so users know when the report was last updated.
Optimise reports for desktop and mobile users where mobile consumption is a real requirement.
How to Measure the Success of a Power BI PSA Implementation
A Power BI implementation should be measured by operational and commercial outcomes, not only by the number of reports published. Baseline measures should be captured before deployment so the organisation can quantify improvement.
Reduction in manual reporting and spreadsheet preparation time.
Increased dashboard adoption among the intended user groups.
Improved timesheet submission and approval compliance.
Faster identification of project overruns and delivery risks.
More accurate revenue, cost, and resource forecasts.
Improved billable utilisation without unsustainable over-allocation.
Better project and client margins.
Reduced unbilled revenue and fewer billing delays.
Faster month-end project reporting and reconciliation.
Improved confidence in management information.
Success measures should have an owner, target, and review cadence. For example, a goal to reduce manual reporting time should specify the current hours spent, the target reduction, and the teams included. A goal to improve forecast accuracy should define the forecast horizon and acceptable variance.
Conclusion
Power BI gives project management and PSA organisations a connected view of project delivery, resource utilisation, financial performance, and client profitability. It helps move reporting away from disconnected spreadsheets and isolated system reports toward a governed analytical model that supports the full project lifecycle.
Our Power BI consultants help project-based organisations design data models, integrate PSA and finance systems, and build dashboards that support real operational and commercial decisions.
Contact us to discuss your Power BI and PSA reporting requirements.