Introduction
At Versich, we spend a lot of our time inside Power BI models, and if there is one decision that shapes everything else about a report's speed, stability, and long-term maintainability, it is how we structure the data model. Long before anyone writes a single DAX measure, the choice between a star schema and a snowflake schema quietly determines how fast that measure will run, how easy it will be to troubleshoot, and how well the model will scale as data volumes grow.
We often meet clients who come to us with reports that feel sluggish, visuals that take several seconds to render, and refresh times that keep creeping upward. In many of these cases, the root cause is not a poorly written DAX formula. It is the underlying data model working against the DAX engine instead of with it. In this blog, we want to walk through what star and snowflake schemas actually are, how each one interacts with the DAX engine, and why we almost always guide our clients toward a star schema when we build Power BI solutions for them.
Our goal here is to give you a practical, real-world view of this topic, not just a textbook definition. By the end of this blog, we hope you will have a clear picture of why data modeling is the foundation of DAX performance, and why getting it right early saves so much time and frustration later.
We also want to be clear that neither schema is universally right or wrong. Both approaches come from real design philosophies with real strengths. The question we ask ourselves on every project is not which schema is theoretically better in isolation, but which schema will let the DAX engine do the least amount of unnecessary work while still giving business users an intuitive, accurate view of their data.
What Is a Star Schema
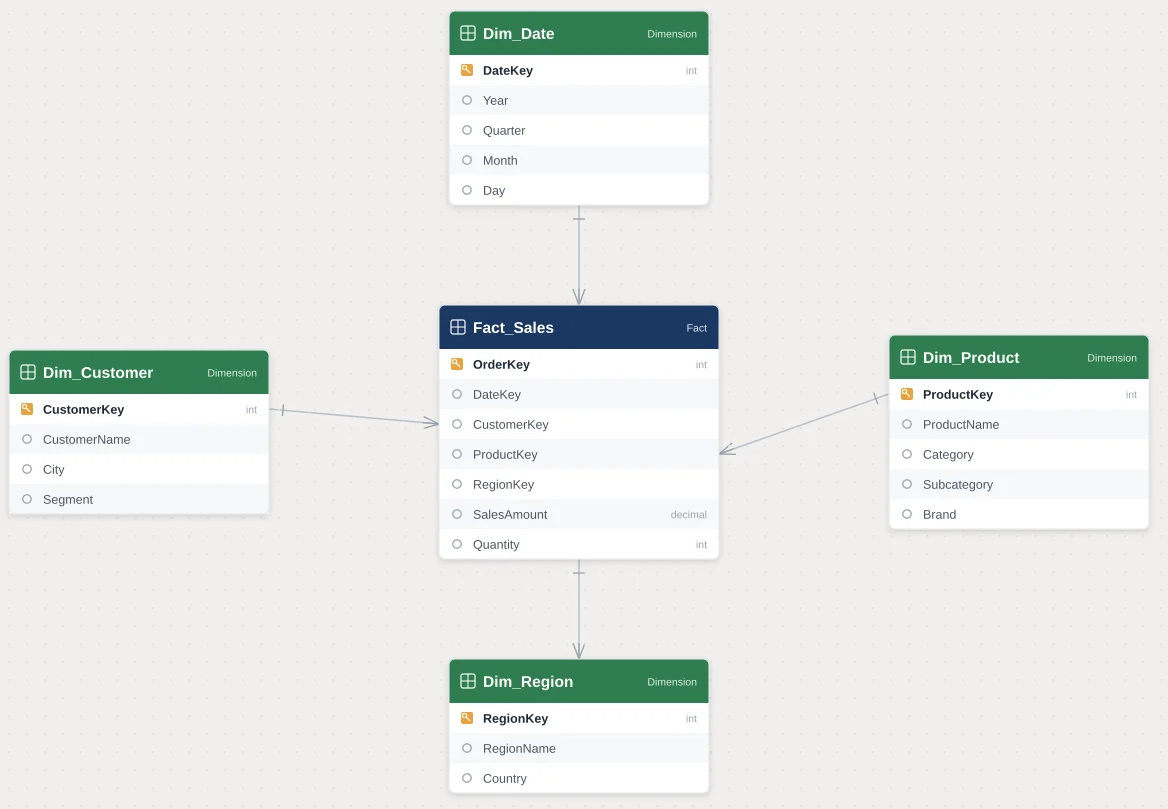
A star schema is a data modeling approach where we place a central fact table, containing our measurable business events such as sales, transactions, or orders, and connect it directly to a set of surrounding dimension tables, such as Customer, Product, Date, and Region. Each dimension table connects to the fact table through a single, direct relationship, which is why the layout resembles a star when we look at it in the Power BI model view.
In our experience, this structure is intentionally denormalized. That means a dimension table like Product might repeat the category name, subcategory name, and brand name across many rows, rather than splitting those attributes into separate related tables. This repetition might look inefficient from a database design perspective, but for Power BI and DAX, it is exactly what the engine is optimized to work with.
- One fact table holding numeric, aggregatable data.
- Multiple dimension tables, each describing a different business attribute.
- Single-hop relationships between each dimension and the fact table.
- Minimal joins required to answer most business questions.
We often describe a star schema to our clients using a simple analogy. Picture a sales fact table sitting in the middle of a model, with lines running outward to Customer, Product, Date, and Region. No matter which of those dimensions a user filters by, DAX only has to travel one step to reach the fact table and apply that filter. There is no detour through an intermediate table, no extra lookup, and no ambiguity about which path the filter should take. That simplicity is what makes a star schema so predictable to build on top of.
We also find that a star schema tends to match the way business users naturally think about their data. A sales manager does not think of Category, Subcategory, and Product Name as three separate concepts living in three separate tables. They think of a product as one thing with several descriptive attributes. When our model mirrors that mental model, report authors spend less time hunting for fields across a scattered list of tables and more time building the analysis they actually need.
What Is a Snowflake Schema
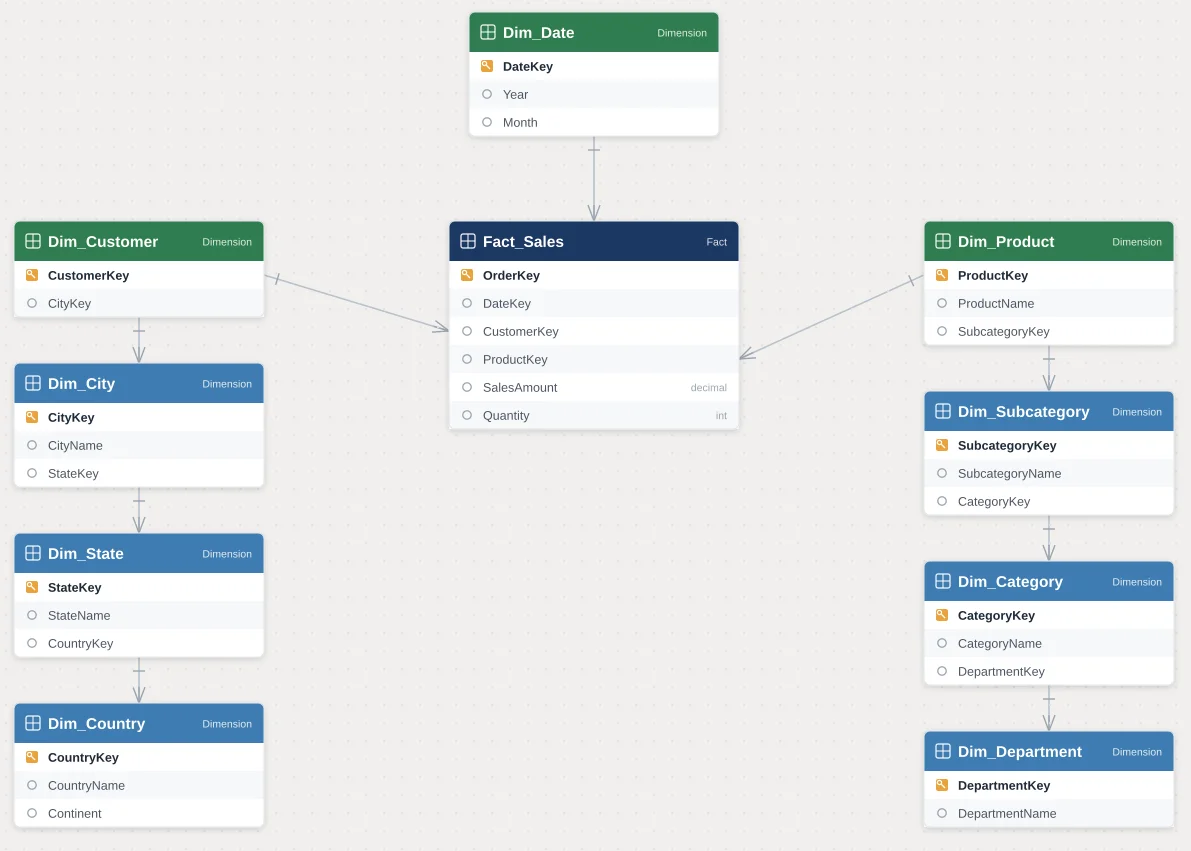
A snowflake schema takes the same basic idea of fact and dimension tables, but normalizes the dimension tables further. Instead of one flat Product table, we might split it into Product, Subcategory, and Category tables, each linked to the next in a chain. The result, when we look at the model diagram, branches outward like a snowflake rather than a clean star.
We usually see snowflake structures in source systems and traditional relational databases, where normalization reduces data redundancy and enforces referential integrity. That is a sound design principle for transactional systems. However, when we bring that same structure directly into a Power BI semantic model without reshaping it, we are asking the DAX engine to do considerably more work every time a user interacts with a report.
- Dimension attributes split across multiple related tables.
- Multi-hop relationships, where a fact table connects to a dimension, which connects to another dimension.
- Reduced data redundancy, but increased relationship complexity.
- More tables overall for the same business information.
We understand why snowflake structures exist in the first place. In a transactional database, normalization prevents the same category name from being typed and stored thousands of times, which keeps storage efficient and makes updates safer, since changing a category name only requires updating one row rather than thousands. That is a completely reasonable design goal for a system that is recording business transactions as they happen.
The trouble starts when that same structure is imported into Power BI without any reshaping. A semantic model is not a transactional system. It is built to answer analytical questions quickly, and the DAX engine is optimized for that specific job. When we leave a snowflake structure untouched, we are essentially asking a tool that was designed for fast analytical reads to behave like a transactional database, and that mismatch is where performance problems tend to begin.
How the DAX Engine Actually Processes a Model
To understand why schema choice matters so much, we find it helpful to explain briefly how the DAX engine works behind the scenes. Power BI models typically run on the VertiPaq engine, an in-memory, columnar storage engine that compresses data and is exceptionally fast at scanning and aggregating single tables. On top of VertiPaq sits the Formula Engine, which interprets our DAX expressions and requests the data it needs from the Storage Engine.
When a visual asks for a value, DAX has to resolve relationships between tables to figure out which rows apply. In a star schema, this resolution is straightforward because each dimension has one direct relationship to the fact table. In a snowflake schema, the engine may need to traverse two, three, or more relationships just to apply a single filter, such as filtering by product category when category lives several tables away from the fact table.
Each additional hop adds computational overhead, more relationship evaluations, and more opportunities for filter context to behave unexpectedly. This is precisely why we tell our clients that data modeling is not a cosmetic decision. It is a performance decision that shows up the moment real users start slicing and dicing their reports.
We also remind clients that VertiPaq compresses each column independently, and it is very good at scanning long, narrow columns quickly. What it is not naturally good at is stitching together many small tables on the fly to answer one question. Every relationship we ask it to cross is a request for extra bookkeeping, and while a single extra hop might not be noticeable on a small dataset, that same hop can become very expensive once a model reaches millions of rows or once several relationships are chained together across a report with many interactive visuals.
This is also why we pay close attention to relationship cardinality and cross-filter direction during the modeling phase. A one-to-many relationship with a single-direction filter is the cheapest and most predictable pattern for the engine to evaluate. Bidirectional relationships and many-to-many patterns, which show up far more often in snowflake structures, ask the engine to do considerably more reasoning before it can return a result, and that reasoning takes time.
Star Schema and DAX Performance
When we build models using a star schema, we consistently see faster query response times, and there are clear reasons behind this. Because each dimension connects directly to the fact table, DAX only needs to resolve a single relationship to apply a filter, which keeps the Formula Engine's work simple and predictable.
We also find that star schemas make it much easier to write clean, efficient DAX measures. Functions like CALCULATE, FILTER, and time intelligence patterns behave more predictably when filter context flows through a single, direct path rather than cascading across several linked tables. This reduces the risk of ambiguous filter propagation, ghost relationships, and unexpected blank values in visuals.
- Faster visual rendering, since fewer joins are required per query.
- More predictable filter context, which reduces DAX debugging time.
- Simpler relationship management, since Power BI's automatic relationship detection works more reliably.
- Better compression by VertiPaq in many practical scenarios, since fact tables can reference fewer, well-structured dimension keys.
In nearly every Power BI project we deliver, we start by reshaping source data into a star schema during the data transformation stage, well before any dashboard design begins. We consider this one of the highest-leverage steps in the entire project.
Snowflake Schema and DAX Performance
Snowflake schemas are not inherently wrong, but they do introduce measurable performance costs inside Power BI. Every additional table in the relationship chain means DAX has to work harder to resolve context transitions, and that extra work becomes especially noticeable in large models or reports with many slicers and cross-filtering visuals.
We have also seen snowflake structures introduce more subtle issues, such as bidirectional filtering being applied inconsistently across a chain of tables, or measures returning unexpected totals because a filter did not propagate through every hop the way the report author expected. These issues are harder to diagnose because the problem is often several relationships removed from where the symptom appears.
- Slower query resolution due to multi-hop relationship traversal.
- Increased complexity when troubleshooting incorrect totals or blank values.
- More relationships to maintain and validate as the model grows.
- Higher risk of accidental many-to-many relationships forming as tables are added.
We do still use snowflake structures in specific situations, particularly when a dimension genuinely has its own complex sub-hierarchy that business users need to manage independently, such as a detailed geography hierarchy with many shared reference tables. Even then, we typically try to flatten as much as possible into the model layer using Power Query before the data ever reaches DAX.
A Practical Example From Our Own Experience
To make this less abstract, we want to walk through a simplified version of a project we have seen play out more than once. A client comes to us with a sales reporting model built directly from their ERP export. The Product dimension in that export is split into four separate tables: Product, Subcategory, Category, and Department. Each table connects to the next in a chain, and the chain connects to the fact table through the Product table at the very end.
A simple visual showing total sales by Department requires DAX to filter Department, propagate that filter through Category, then through Subcategory, then through Product, and only then apply it to the fact table. On a small dataset, this might complete in well under a second and nobody notices. On a larger dataset, with several such visuals on one page and users applying multiple slicers at once, we have seen this exact pattern turn a report that should load in one or two seconds into one that takes ten seconds or more.
When we take on a project like this, one of our first moves is to use Power Query to merge Product, Subcategory, Category, and Department into a single flattened Product dimension table, with Department, Category, and Subcategory represented as columns rather than separate tables. The fact table then connects to this one dimension through a single relationship. The same visual that once required four hops now requires one, and in our testing, this kind of change alone often accounts for the majority of the performance improvement a client notices after we deliver the project.
We share this example because it captures something important. The fix was not a clever DAX trick or an exotic measure. It was a modeling decision made before a single visual was built. That is the pattern we see again and again in our work, and it is why we spend so much of our project time on the model itself rather than jumping straight into building measures and dashboards.
Questions We Hear Often From Clients
Because this topic comes up on nearly every project we deliver, we want to address a few of the questions we hear most frequently from the teams we work with.
Does a snowflake schema ever outperform a star schema? In our experience, this is rare in a Power BI context. There are edge cases involving very specific storage constraints or highly specialized reporting needs, but for the vast majority of Power BI models we build, a star schema outperforms a snowflake schema on every DAX-heavy report we test.
Do we have to give up normalization entirely? Not in the source system. We keep normalization where it belongs, in the transactional database, and we reshape the data during the transformation stage so the semantic model that DAX actually queries is denormalized into a clean star schema.
Will flattening our tables cause us to lose data? No. Flattening combines descriptive attributes into fewer tables, but every attribute is still present in the model. We are changing how the information is organized, not removing any of it.
How do we know if our current model is hurting performance? We typically start with a quick audit using Performance Analyzer and DAX Studio to see how long visuals take to render and how many relationships are being traversed. This usually gives us a clear picture within a short amount of time, well before we recommend any changes.
Star Schema vs. Snowflake Schema at a Glance
We put together the table below to summarize how these two approaches compare across the factors that matter most to us when we are designing a Power BI semantic model for a client.
| Factor | Star Schema | Snowflake Schema |
|---|---|---|
| Table structure | Flat, denormalized dimension tables | Normalized dimension tables split into sub-tables |
| Relationships | Single-hop, one-to-many from dimension to fact | Multi-hop chains across several related tables |
| DAX engine load | Fewer joins for the Storage Engine to resolve | More joins, more relationship traversals per query |
| Filter propagation | Direct and predictable | Depends on cross-filter direction across multiple hops |
| Model size on disk | Slightly larger due to repeated attribute values | Smaller due to normalization |
| Refresh and maintenance | Simpler to refresh and validate | More tables to refresh, validate, and keep in sync |
| Best suited for | Power BI and DAX-driven reporting models | Source systems and OLTP-style data warehouses |
| Our general recommendation | Preferred for almost all Power BI semantic models | Only when a specific business rule truly requires it |
How We Approach Data Modeling for Our Clients
When we take on a new Power BI project, one of our first steps is always to assess the source data structure and identify where normalization is helping the business and where it is only adding friction for reporting. Our approach generally follows a consistent pattern that we have refined across many engagements.
- We map out the source system relationships before building anything in Power BI.
- We flatten unnecessary normalization using Power Query, pulling attributes like category and subcategory back into a single dimension table.
- We keep fact tables focused strictly on measures and foreign keys, avoiding descriptive attributes that belong in dimensions.
- We validate relationship cardinality and cross-filter direction for every relationship in the model.
- We test performance using Performance Analyzer and DAX Studio before handing the report over to end users.
This process helps us catch performance issues early, long before a client's end users encounter a slow dashboard. We would rather spend extra time reshaping the model up front than have our clients troubleshoot vague performance complaints months later.
We also pay close attention to naming conventions and hierarchy design at this stage, since a clean star schema loses much of its value if business users cannot find the fields they need or understand how a hierarchy is organized. We typically group related attributes into clear hierarchies within a single dimension table, so a user browsing the Product dimension sees Category, Subcategory, and Product Name laid out in a logical order, without needing to know that this information once lived across three separate tables in the source system.
Once the model is in a good state, we spend time validating it under realistic conditions rather than just checking that it looks correct. We build out a handful of the report's busiest visuals, apply the filters and slicers a typical user would apply, and watch how the model responds. This step often reveals small adjustments that make a meaningful difference, such as removing an unused bidirectional relationship or splitting an oversized dimension table that was quietly working like a fact table in disguise.
Common Pitfalls We Help Clients Avoid
Over the years, we have worked with many organizations that inherited Power BI models built directly on top of a snowflake-style database export, without any reshaping. These are some of the recurring issues we see and help resolve.
- Reports built directly on normalized source tables without any transformation layer.
- Multiple small dimension tables that could easily be merged into one clean dimension.
- Long relationship chains that make troubleshooting a broken measure far more time consuming than it should be.
- Bidirectional relationships used to patch filtering issues that a star schema would have avoided entirely.
- Refresh times that grow disproportionately as data volume increases, because the model has far more tables and relationships than necessary.
In almost every one of these engagements, moving toward a star schema, even partially, produced a noticeable improvement in report speed and a significant reduction in the time it took our clients' internal teams to maintain the model going forward.
What stands out to us most in these projects is how often the fix is not a rewrite of every DAX measure in the model. It is a restructuring of the tables those measures depend on. Once the model itself is clean, many measures that previously felt slow or unreliable start behaving correctly without a single line of DAX being changed. That is usually the moment a client tells us the report finally feels the way they expected it to feel from the start.
Conclusion
Data modeling decisions made early in a Power BI project have a lasting impact on everything that follows, from how quickly visuals render to how confidently users can trust the numbers they see on screen. In our experience, a well-designed star schema consistently gives the DAX engine what it needs to perform efficiently, while a snowflake schema, however well-intentioned, tends to introduce complexity that slows reports down and makes troubleshooting harder over time.
We believe that investing time in the right data model at the start of a project is one of the most valuable things we can do for our clients. It is not the most visible part of a Power BI solution, but it is the foundation everything else is built on.
If you would like our team to review your current Power BI data model or help you design a new one built for performance, we would be happy to talk. You can reach out to us through our Contact Us page, and we will be glad to help.