Introduction
Banks and financial services companies operate in one of the most data-intensive and highly controlled industries. Every day, they process customer transactions, loan applications, payments, deposits, investment activity, insurance claims, treasury movements, regulatory submissions and operational events. The challenge is not a lack of data. The challenge is turning fragmented, sensitive and time-critical data into accurate information that decision-makers can trust.
Traditional reporting environments often depend on spreadsheets, static management packs and disconnected reports created by separate departments. Finance may calculate profitability one way, risk may use another customer hierarchy, and operations may maintain its own view of branch or channel performance. These differences create reconciliation work, slow down decisions and increase the risk of inconsistent reporting.
Microsoft Power BI provides a modern business intelligence platform for connecting data, creating reusable analytical models and delivering interactive reports to authorised users. When supported by strong governance, security and data management, Power BI can help financial institutions improve financial reporting, risk visibility, customer analysis, operational control and executive decision-making.
At Versich, our Power BI consulting services help organisations design scalable reporting environments, integrate complex data sources and create decision-ready dashboards aligned with business and control requirements.
What Is Power BI for Banks and Financial Services Companies?
Power BI for banks and financial services companies refers to the use of Microsoft Power BI as an analytics and reporting layer across financial, customer, risk, regulatory and operational data. It can be used by commercial banks, retail banks, credit unions, building societies, lenders, payment companies, fintech businesses, investment firms, asset managers, wealth managers, insurance companies and other financial institutions.
Power BI does not replace core banking platforms, general ledgers, loan origination systems, payment processors, fraud platforms or regulatory reporting applications. Instead, it connects to these systems and presents information through governed semantic models, dashboards, reports and alerts. This allows teams to analyse performance without repeatedly extracting data into isolated spreadsheets.
A well-designed banking analytics environment normally includes several layers: source systems, data integration, a governed data platform, reusable Power BI semantic models, role-based reports and monitoring processes. The quality of the reports depends on the quality of the underlying architecture, ownership and controls.
Why Financial Institutions Need Modern Business Intelligence
Financial institutions must make decisions across profitability, liquidity, credit risk, fraud, customer service, compliance and operational resilience. These decisions often depend on information held across multiple platforms and legal entities. Without an integrated analytics layer, reporting becomes slow, labour-intensive and difficult to validate.
- Data is distributed across core banking, ERP, CRM, lending, payment, treasury, card, investment, claims and compliance platforms.
- Reports may use different definitions for customers, products, branches, segments, balances, revenue and risk classifications.
- Manual spreadsheet processes increase reconciliation effort and make report lineage difficult to demonstrate.
- Senior management requires faster access to current performance, exceptions and emerging risks.
- Regulated institutions need controlled access, documented calculations, reliable refresh processes and evidence of review.
- Customers increasingly interact through digital channels, creating demand for more detailed behavioural and service analytics.
Power BI addresses these challenges by providing a consistent visual and analytical layer. However, the platform should be implemented as part of an enterprise data and governance strategy, not as a standalone dashboard project.
Key Benefits of Power BI for Banks and Financial Services
Benefit | Business impact |
Faster reporting | Automates recurring data preparation and replaces parts of the manual reporting cycle with scheduled, governed refreshes. |
Consistent metrics | Creates reusable definitions for revenue, margin, balances, delinquency, customer activity and operational performance. |
Improved visibility | Allows executives and managers to move from summary measures to underlying products, regions, branches, portfolios and transactions. |
Stronger risk monitoring | Surfaces concentrations, exceptions, threshold breaches and changes in credit, liquidity, operational or conduct risk indicators. |
Better customer insight | Combines relationship, product, channel and service information to support segmentation and retention analysis. |
Controlled access | Uses workspace permissions, row-level security and related controls so users see information appropriate to their responsibilities. |
Scalable analytics | Supports enterprise reporting and governed self-service analysis through shared data models and certified content. |
Reduced spreadsheet dependency | Moves recurring analysis away from uncontrolled copies and toward centrally managed reports and definitions. |
Power BI Use Cases for Banking and Financial Services
The strongest Power BI programmes focus on specific business decisions and control requirements. The following use cases are commonly prioritised because they connect reporting to financial outcomes, risk management and service performance.
Executive and Management Reporting
Executive dashboards provide a consolidated view of financial performance, balance sheet movements, customer growth, portfolio quality, liquidity, risk indicators and operational performance. Instead of waiting for a static month-end pack, authorised leaders can review current results and investigate the drivers behind changes.
- Profit and loss performance by entity, business line and product
- Actual versus budget and forecast
- Net interest income and non-interest income
- Deposit and lending growth
- Cost-to-income ratio
- Capital, liquidity and risk indicators
- Operational incidents and service performance
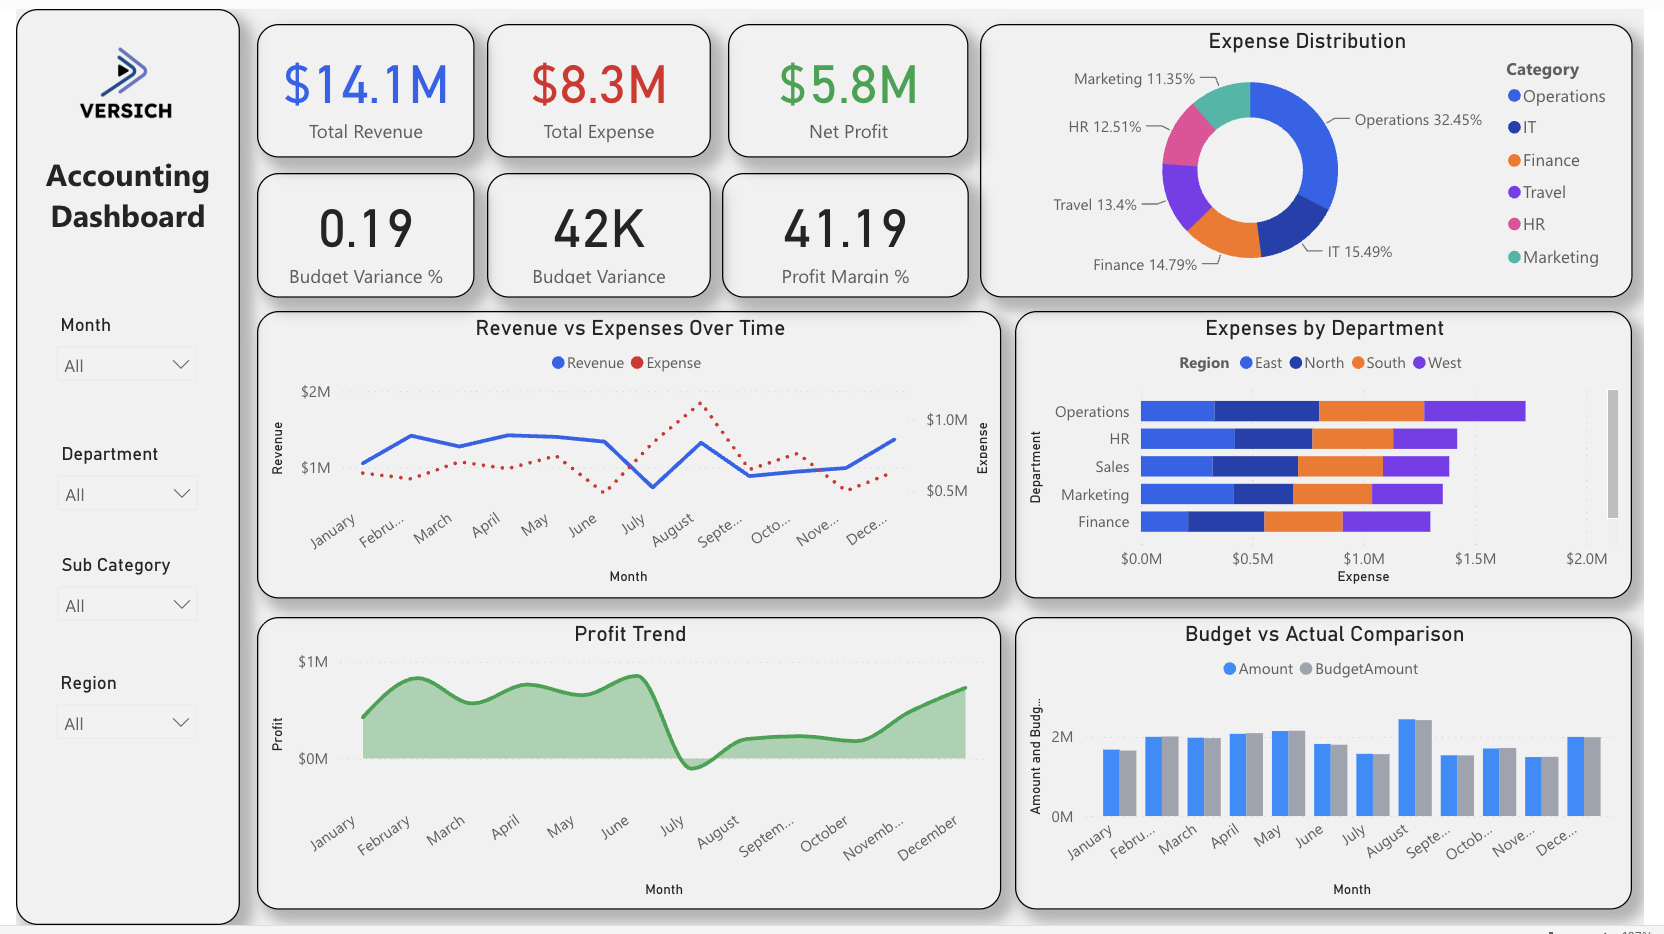
See below a sample Executive and Accounting Dashboard. Click here for the live interactive version
Finance, FP&A and Profitability Analytics
Finance teams can use Power BI to combine general ledger, planning, product, customer and operational data. This supports management reporting, forecasting, cost analysis and profitability measurement at a more useful level of detail.
- Income statement and balance sheet analysis
- Product, branch and customer profitability
- Revenue and expense variance analysis
- Cost allocation reporting
- Entity and consolidation reporting
- Budget ownership and forecasting dashboards
- Close status and reconciliation monitoring
Lending and Credit Risk Analytics
Banks and lenders can monitor the lending lifecycle from application through underwriting, approval, funding, servicing, delinquency and recovery. Power BI can provide portfolio views while also allowing analysts to drill into specific segments and accounts, subject to access controls.
- Application volume and approval rate
- Average decision and funding time
- Exposure by sector, geography and risk grade
- Loan-to-value and debt-service indicators
- Delinquency, arrears and non-performing loan trends
- Vintage and cohort performance
- Collections effectiveness and recoveries
Treasury, Liquidity and Asset Liability Management
Treasury teams need timely information about cash positions, funding, maturities, interest-rate sensitivity and liquidity. Power BI can present data from treasury platforms, core banking systems and the general ledger in dashboards designed for daily monitoring and management review.
- Cash and liquidity positions
- Deposit concentration and funding mix
- Maturity ladders and contractual cash flows
- Interest-rate exposure and repricing gaps
- Liquidity threshold monitoring
- Counterparty exposure
- Foreign exchange and investment positions
Fraud, AML and Financial Crime Monitoring
Power BI can complement specialist fraud and anti-money laundering platforms by providing management information, operational oversight and trend analysis. It should not replace transaction-monitoring engines, case-management tools or required regulatory processes.
- Alert volumes and ageing
- Case throughput and investigator workload
- Suspicious activity trends
- False-positive and escalation rates
- Customer risk-rating distribution
- High-risk geography or product exposure
- Control exceptions and remediation tracking
Customer and Relationship Analytics
A consolidated customer view helps institutions understand product holdings, engagement, value, service interactions and attrition risk. Power BI can combine CRM, core banking, digital channel and customer support information to support relationship management and service improvement.
- Customer acquisition and activation
- Products per customer or household
- Deposit, lending and investment balances
- Digital adoption and channel preference
- Customer complaints and service issues
- Attrition and dormancy indicators
- Cross-sell and next-best-action analysis
Branch, Channel and Contact Centre Performance
Banks can compare physical and digital service channels using a consistent performance framework. This helps management identify capacity constraints, service gaps and opportunities to improve the customer experience.
- Branch transactions and sales
- Footfall and appointment volumes
- Digital and mobile banking usage
- Call volumes, wait times and abandonment
- First-contact resolution
- Service-level achievement
- Cost per transaction or interaction
Regulatory, Compliance and Control Reporting
Power BI can support internal compliance monitoring, regulatory data preparation and evidence-based management review. It is important to maintain clear data lineage, validation, ownership and approval controls. The platform itself does not make an institution compliant.
- Regulatory submission status
- Control completion and exception tracking
- Policy breaches and overdue actions
- Data-quality and reconciliation dashboards
- Audit issue remediation
- Third-party risk oversight
- Operational resilience and incident metrics
Wealth, Investment and Asset Management Analytics
Investment and wealth management firms can use Power BI to analyse assets under management, net flows, client activity, fees, investment performance and adviser productivity. Calculations should be governed carefully, especially where performance or client reporting is involved.
- Assets under management and administration
- Net inflows and outflows
- Performance against benchmarks
- Fee revenue and margin
- Client and adviser segmentation
- Portfolio concentration
- Client onboarding and review status
Insurance and Claims Analytics
For insurers and financial services groups with insurance operations, Power BI can provide insight into premiums, underwriting performance, claims, reserves, distribution and service.
- Gross and net written premium
- Loss ratio and combined ratio
- Claims frequency and severity
- Claims ageing and settlement time
- Reserve movements
- Broker and channel performance
Here’s a sample Insurance and Claims Analytics Dashboard. Click here for the live interactive version 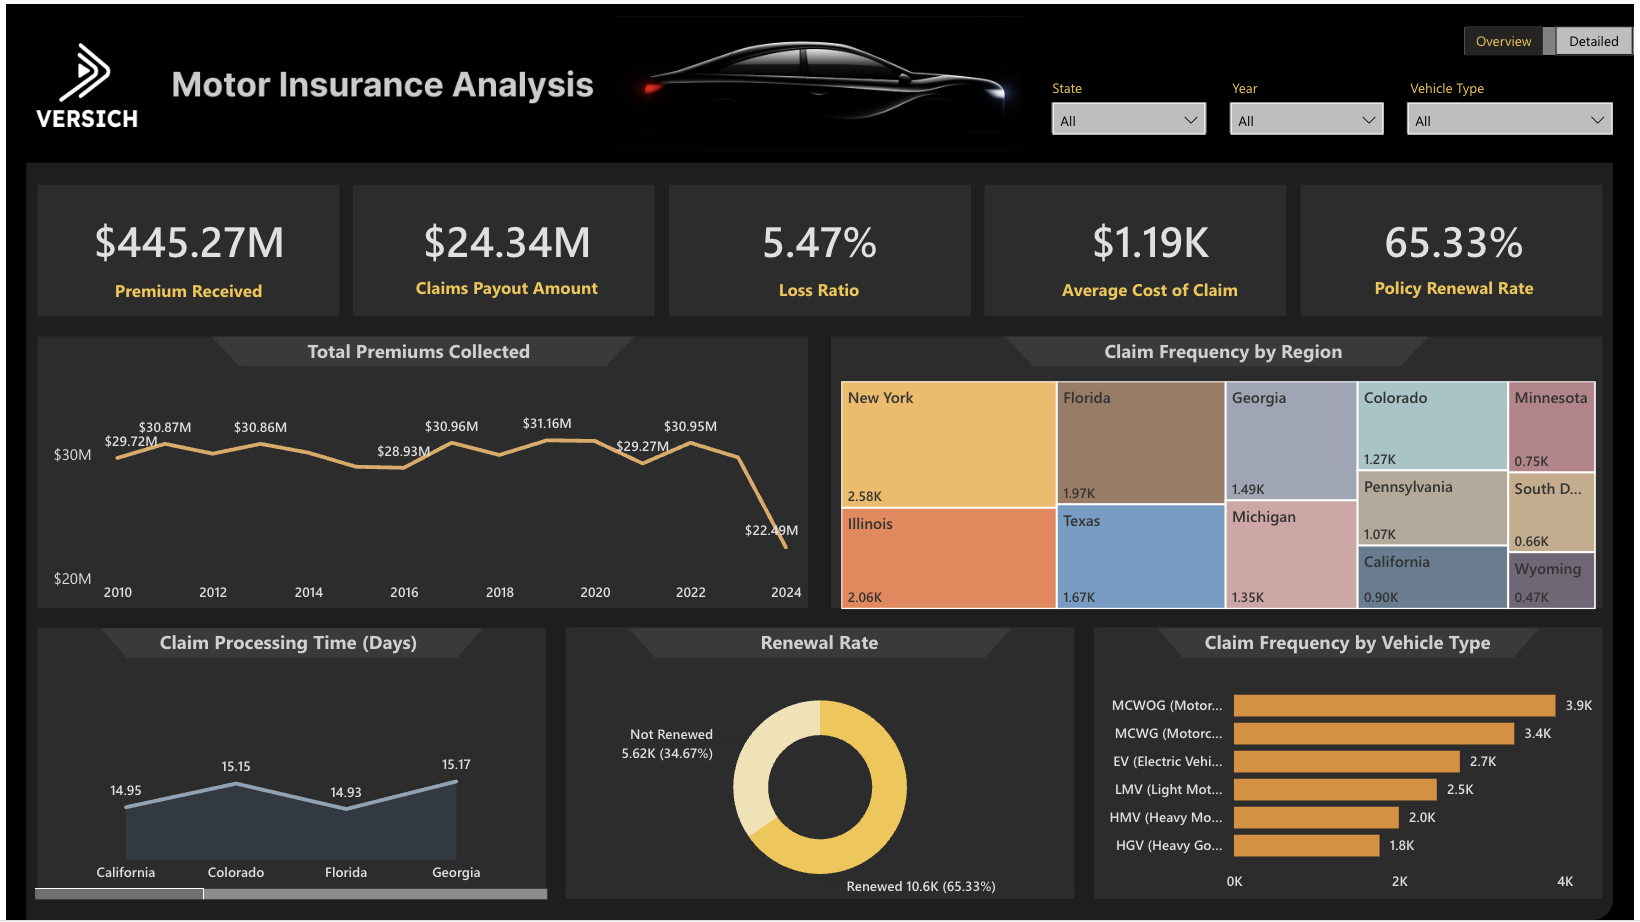
Recommended Power BI Dashboards for Financial Institutions
Dashboard | Typical measures | Primary users |
Executive performance dashboard | Revenue, profit, balance sheet, customer, risk and operational indicators | Board, executive committee, business leaders |
Finance and profitability dashboard | Income, expenses, margin, budget variance, entity and product profitability | CFO, FP&A, controllers, finance business partners |
Credit portfolio dashboard | Exposure, risk grades, arrears, defaults, concentrations and vintage performance | Chief risk officer, credit, collections, portfolio teams |
Liquidity and treasury dashboard | Cash positions, funding, maturities, concentration and threshold monitoring | Treasury, ALCO, finance, risk |
AML and fraud operations dashboard | Alerts, cases, ageing, workload, escalation and outcomes | Compliance, fraud, operations, internal audit |
Customer analytics dashboard | Acquisition, product holdings, value, activity, satisfaction and attrition | Retail banking, commercial banking, marketing, relationship teams |
Branch and channel dashboard | Transactions, sales, service, digital usage and channel cost | Operations, branch leaders, digital teams |
Regulatory and controls dashboard | Submissions, reconciliations, control exceptions, incidents and remediation | Compliance, risk, finance, audit |
Important Banking and Financial Services KPIs
Area | Example KPIs |
Financial performance | Net interest margin, return on assets, return on equity, cost-to-income ratio, fee income, operating expense variance |
Customer and deposits | Customer growth, active customers, deposits, average balance, deposit concentration, products per customer, attrition rate |
Lending | Applications, approval rate, funded value, average loan size, delinquency rate, non-performing loan ratio, net charge-off rate |
Liquidity and capital | Liquidity coverage measures, funding mix, maturity profile, capital ratios, risk-weighted assets, concentration indicators |
Operations | Transaction volumes, straight-through processing rate, turnaround time, exception rate, service-level achievement, cost per transaction |
Compliance and risk | Open alerts, aged cases, overdue actions, control failures, operational losses, incidents, audit findings and remediation status |
Wealth and investments | Assets under management, net flows, fee yield, client retention, adviser productivity, portfolio concentration |
Insurance | Premium growth, loss ratio, combined ratio, claims frequency, claims severity, settlement time and retention |
Integrating Power BI with Banking and Financial Systems
A bank may have dozens or hundreds of systems contributing to management and regulatory reporting. Connecting Power BI directly to every operational platform is rarely the best enterprise approach. A governed architecture usually extracts and standardises data in a warehouse, lakehouse or similar analytical platform before it is presented through Power BI.
Source category | Example data |
Core banking and deposits | Accounts, balances, transactions, interest, fees, products and customer relationships |
Loan origination and servicing | Applications, decisions, facilities, repayments, collateral, arrears and collections |
ERP and general ledger | Financial actuals, chart of accounts, entities, cost centres, journals, payables and receivables |
CRM and customer service | Prospects, relationships, activities, complaints, cases and service history |
Payments and cards | Payment volumes, settlement, chargebacks, merchant activity, card usage and exceptions |
Treasury and investment platforms | Cash, funding, securities, derivatives, counterparties and market data |
Fraud and AML platforms | Alerts, cases, risk ratings, dispositions and investigator activity |
Planning and forecasting systems | Budgets, forecasts, scenarios, assumptions and management targets |
External and reference data | Market rates, credit data, economic indicators, regulatory classifications and geographic reference data |
Power BI supports a wide range of connectivity options. For on-premises sources, an enterprise gateway can provide a controlled bridge to the Power BI service. Institutions may also use Azure, Microsoft Fabric, SQL databases, data warehouses, APIs, secure file transfers and integration platforms as part of the data pipeline.
Where source systems do not provide suitable native connectors, our API development services can support secure, documented integrations that move and validate data between applications.
A Reference Architecture for Banking Analytics
- Identify authoritative source systems for each business domain, including customers, products, accounts, transactions, finance, risk and compliance.
- Ingest data into a controlled analytical platform using scheduled pipelines, APIs, secure files, database replication or approved integration tools.
- Apply validation, reconciliation, transformation and master-data rules before the information reaches reporting models.
- Create reusable Power BI semantic models with consistent dimensions, measures, hierarchies and business definitions.
- Publish reports through separate development, testing and production workspaces with documented release and approval procedures.
- Apply role-based access, monitoring, sensitivity classification, retention and usage controls.
- Monitor refresh performance, data quality, report usage and failed processes, then assign owners to resolve exceptions.
For financial institutions, the semantic model is a controlled business layer. It should define metrics once, document calculation logic and reduce competing versions of the same KPI. |
Security, Governance and Compliance Considerations
Security and governance must be designed at the beginning of a financial services Power BI programme. Adding access restrictions after reports have already been widely distributed creates unnecessary risk and rework.
- Identity and access management: Use managed identities, security groups, multifactor authentication and least-privilege access. Avoid assigning broad workspace roles simply to let users view reports.
- Row-level and object-level security: Restrict data by legal entity, business unit, region, portfolio, branch, team or customer population. Test effective access with representative user roles.
- Data classification: Classify reports and data according to the organisation’s information-protection policy. Sensitive financial, personal and payment information should receive appropriate labels and handling controls.
- Environment separation: Maintain clear development, testing and production environments. Changes should be tested, approved and traceable before reaching end users.
- Data lineage and ownership: Document where data comes from, who owns it, how it is transformed and which controls validate it. Assign business and technical owners for critical metrics.
- Reconciliation and validation: Reconcile financial and risk reports to authoritative systems. Use tolerance rules, exception logs and sign-off procedures for material reports.
- Export and sharing controls: Review the business need for export, external sharing, publish-to-web and unmanaged downloads. High-risk options should be disabled or tightly restricted.
- Audit and monitoring: Monitor workspace activity, refresh failures, permissions, sharing, usage and changes. Define who reviews logs and how exceptions are escalated.
- Business continuity: Document dependencies, gateway architecture, recovery procedures, support ownership and alternative reporting arrangements for critical dashboards.
Depending on the organisation and jurisdiction, relevant frameworks may include BCBS 239, FFIEC guidance, BSA/AML requirements, SOX, GDPR, DORA, PCI DSS and internal model or regulatory reporting standards. Power BI can support controlled data aggregation and reporting, but compliance depends on the complete operating model, including policies, processes, data quality, validation, security and human oversight.
Power BI Deployment Options for Financial Institutions
The appropriate deployment model depends on data sensitivity, infrastructure, regulatory expectations, existing Microsoft investments and operational requirements.
Deployment model | Description | Typical fit |
| Cloud-based collaboration, distribution, refresh and governance within Microsoft Fabric and Power BI capabilities. | Organisations permitted to use cloud analytics and able to implement required controls. |
| Cloud reporting with controlled access to on-premises systems through enterprise gateways or staged data platforms. | Institutions with a mixture of legacy on-premises systems and cloud services. |
| On-premises report hosting for specific scenarios where cloud deployment is restricted or not currently approved. | Organisations with strict on-premises requirements, while recognising feature differences from the cloud service. |
| Power BI content embedded into a customer, partner or employee application with application-level security design. | Fintech platforms, portals and operational applications requiring integrated analytics. |
Licensing should be assessed based on the number of report creators and viewers, capacity and performance needs, sharing requirements, deployment model and broader Microsoft Fabric strategy. Institutions should also account for non-production environments, gateway architecture, administration, monitoring and support.
Power BI Implementation Approach for Banks and Financial Services
1. Define business outcomes and scope: Prioritise decisions, risks and reporting pain points. A focused first release is more effective than attempting to rebuild every report at once.
2. Assess data and current reporting: Inventory systems, spreadsheets, existing reports, data owners, dependencies, manual adjustments and reconciliation procedures.
3. Establish governance and control requirements: Agree workspace design, access roles, data classification, approval procedures, metric ownership, change control and support responsibilities.
4. Design the analytical architecture: Choose integration patterns, storage, refresh frequency, gateway design, semantic models and environment separation.
5. Build and validate the data model: Create dimensions and measures that reflect the institution’s products, customers, entities and organisational structure. Reconcile outputs to source systems.
6. Develop dashboards around decisions. Design reports for specific user groups. Use exceptions, trends and drivers rather than filling pages with unrelated visualisations.
7. Perform security, performance and user testing. Test access for every role, validate financial totals, challenge calculation logic and confirm reports perform at realistic data volumes.
8. Deploy, train and support users. Release through controlled environments, provide user guidance, monitor adoption and maintain clear support and enhancement processes.
Common Implementation Challenges and How to Address Them
Challenge | Recommended response |
Different definitions across departments | Create a metric catalogue and assign business owners before building dashboards. |
Poor source-data quality | Profile data early, introduce quality rules and display unresolved exceptions transparently. |
Excessive spreadsheet adjustments | Document adjustments, move repeatable logic into governed transformations and retain controlled approval steps where judgement is required. |
Slow or unstable reports | Use an appropriate data model, reduce unnecessary detail, optimise DAX, use aggregation strategies and review refresh design. |
Overly broad user access | Use security groups, viewer roles, row-level security and regular access reviews. |
Uncontrolled self-service reporting | Provide certified models, sandbox workspaces, training and a clear promotion process for enterprise reports. |
Lack of ownership after go-live | Define a product owner, technical support model, change process and service expectations. |
Dashboards that do not drive action | Design around decisions, thresholds, exceptions and accountable owners rather than visual appeal alone. |
Power BI Compared with Spreadsheets and Traditional Reporting
Area | Spreadsheet-led reporting | Governed Power BI reporting |
Data preparation | Repeated manual extracts and transformations | Automated pipelines and reusable transformation logic |
Metric consistency | Multiple formulas and local definitions | Shared semantic models and governed measures |
Distribution | Email attachments and shared folders | Controlled access through workspaces, apps and embedded experiences |
Drill-down | Limited and often manually prepared | Interactive navigation from summary to detail |
Security | File passwords and folder permissions may be difficult to manage | Central identity, workspace access and data-level security options |
Auditability | Version history and logic may be unclear | Documented models, lineage, release processes and usage monitoring |
Scalability | Performance declines as files and users increase | Designed for shared enterprise reporting when architecture is appropriate |
Spreadsheets remain useful for modelling, ad hoc analysis and controlled adjustments. The objective is not to eliminate them entirely. The objective is to prevent critical recurring reports from depending on fragile, manually distributed files when a governed reporting process is more appropriate.
How to Measure the Success of a Power BI Banking Programme
A successful implementation should be measured by business and control outcomes, not by the number of dashboards published. Useful measures include:
- Reduction in time required to prepare monthly, weekly or daily reporting packs
- Reduction in manual reconciliations and repeated data extraction
- Percentage of priority metrics using approved definitions
- Number and ageing of data-quality exceptions
- Report refresh reliability and support response time
- User adoption among targeted management and operational groups
- Retirement of duplicate or obsolete reports
- Faster identification and resolution of risk, financial or service exceptions
- Improved evidence of review, ownership and control completion
Why Work with Our Power BI Consultants?
Financial services analytics requires more than attractive dashboards. It requires an understanding of financial processes, data integration, reporting controls, security, performance and user adoption. Our approach connects business requirements with the technical design needed to deliver maintainable reporting.
- Power BI strategy, architecture and implementation planning
- Data integration across ERP, CRM, banking, lending, payment and operational platforms
- Financial, risk, operational and executive dashboard development
- Semantic model, Power Query and DAX development
- Security, governance and workspace design
- Performance optimisation, testing and controlled deployment
- Ongoing administration, enhancement and user support
Review examples of our work through our Power BI portfolio and Power BI case studies. Organisations that already use Power BI can also engage our Power BI support services for troubleshooting, optimisation, governance and ongoing improvements. For additional delivery capacity, you can hire Power BI developers through our team.
Conclusion
Power BI can help banks and financial services companies move from fragmented, manually prepared reporting to a more connected and controlled analytics environment. It can provide faster access to financial performance, customer behaviour, credit risk, liquidity, fraud operations, compliance activity and service performance.
The platform delivers the most value when it is supported by reliable data integration, consistent definitions, strong security, documented ownership and a controlled deployment process. Financial institutions should begin with high-value decisions and reporting pain points, then expand through reusable data models and governance standards.