Introduction
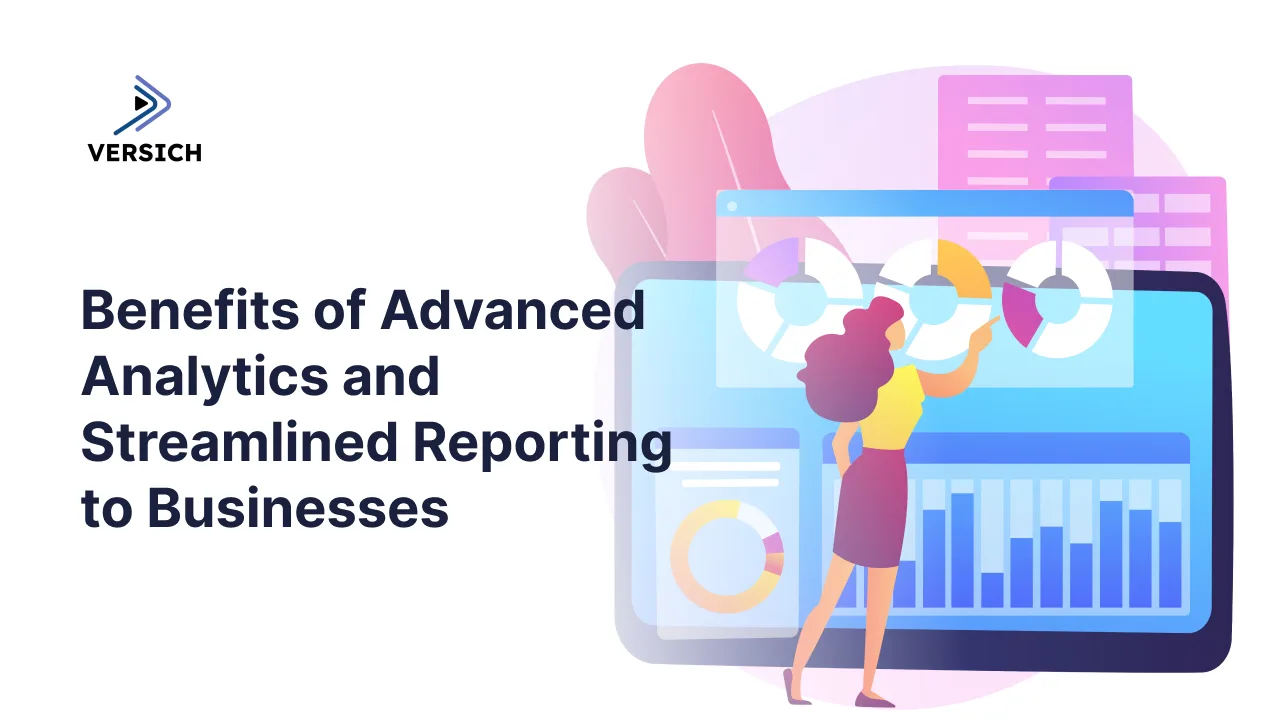
Every business generates data. Sales figures, customer interactions, inventory movements, marketing spend, and financial transactions all leave a trail. The businesses that pull ahead of their competitors are not necessarily the ones collecting the most data, but the ones that turn that data into clear, timely insight through advanced analytics and streamlined reporting.
Advanced analytics refers to techniques that go beyond basic historical reporting, including predictive modelling, trend analysis, and data visualization that reveal patterns a simple spreadsheet cannot show. Streamlined reporting is the discipline of delivering that insight in a consistent, automated, and easily digestible format, rather than through scattered spreadsheets and manual exports. Together, they change how a business understands itself and the market it operates in.
The State of Business Reporting Today
Disconnected data remains the norm rather than the exception. Industry research consistently finds that the large majority of organizations, often cited above 85 percent, struggle with data spread across incompatible systems, and that data silos remain a top-cited concern for a meaningful share of business intelligence teams even in 2026. Many organizations are still leaning on spreadsheets to manage core operational and customer data, despite years of investment in dedicated software.
The financial impact is not abstract. Analyst estimates put the average annual cost of poor data quality in the range of many millions of dollars per organization, and academic research has linked poor data quality to a measurable percentage of lost annual revenue. Separate research into information silos specifically has estimated employees lose a significant portion of the working week simply searching for information across disconnected systems. Whatever the exact figure for a given business, the direction is the same: fragmented data is expensive, and the cost shows up in wasted labour, delayed decisions, and missed opportunities rather than as a single line item anyone notices.
The Challenges Businesses Face Without Streamlined Reporting
Data trapped in silos
When CRM, ERP, e-commerce, and marketing platforms are not connected, each department ends up working from its own version of the truth. A sales team may report one figure for new customers while finance reports another, simply because the two systems define and calculate the metric differently. This is not a minor inconvenience. It forces leadership meetings to spend time reconciling numbers instead of discussing strategy, and over time it erodes confidence in the data altogether.
Manual processes and reconciliation overhead
Without automated pipelines, generating even a routine report often means exporting data from multiple systems, cleaning it in a spreadsheet, and manually building charts. This work typically falls to already stretched finance or operations staff, and research on information silos suggests employees can lose a large portion of their working week to exactly this kind of manual searching and reconciliation. Every hour spent assembling a report is an hour not spent interpreting it.
Slow, backward-looking decisions
Batch-based, manually compiled reporting is inherently a look in the rear-view mirror. By the time a monthly report is finalized, the market conditions it describes may have already changed. Businesses relying on this cadence are structurally unable to respond to shifts in demand, cost, or customer behaviour with any real speed.
Performance and scalability limits
Ad hoc reporting infrastructure that was adequate for a smaller business often breaks down as data volumes grow. Dashboards that once loaded instantly can slow to a crawl once data crosses a certain size threshold, and query times can grow sharply as more products, entities, or transaction volumes are added. This directly damages user adoption. If a report is slow or unreliable, people stop trusting it and go back to their own spreadsheets, reinforcing the very silos the business is trying to eliminate.
Loss of cross-department alignment
Siloed reporting does not only slow finance and operations. It also affects the customer relationship. A support agent without visibility into a customer's full history may ask them to repeat information already given elsewhere, and a marketing team without a unified customer view may target campaigns to customers who already churned or complained. Internally, the same fragmentation makes it harder for departments to agree on shared targets or coordinate on cross-functional initiatives.
The Modern Toolset for Advanced Analytics
The business intelligence and analytics platform market has matured considerably, and most mid-market and enterprise businesses now choose from a small number of leading platforms, each with a different philosophy about how people should interact with data.
Microsoft Power BI
Power BI is built around familiarity and cost efficiency. Its interface mirrors Excel and the wider Microsoft 365 suite, which shortens the learning curve for finance and operations staff who already work in those tools daily. It integrates tightly with Microsoft's cloud ecosystem, offers a free desktop authoring tool, and is generally the most cost-effective of the major platforms to deploy at scale. For businesses already standardized on Microsoft 365 and Azure, and for organizations using NetSuite or QuickBooks as their core financial system, Power BI is frequently the natural fit.
Tableau
Tableau is generally regarded as the strongest platform for visual storytelling and highly customized, presentation-ready dashboards. It rewards investment in training and tends to suit organizations, often those already using Salesforce, where analyst-led visual exploration and client-facing reporting are central to how the business communicates data.
Qlik
Qlik is built around an associative data model rather than the more conventional query-and-filter approach used by Power BI and Tableau. Selecting a value highlights everything associated with it while greying out, rather than hiding, everything excluded, which regularly surfaces relationships in complex data that other tools would not reveal. This makes Qlik particularly strong for exploratory analysis and data discovery in complex, multi-source environments, though it carries a steeper learning curve for teams used to traditional BI.
AI models and agentic coding assistants
Alongside the established BI platforms, general-purpose AI models and agentic coding tools are increasingly part of the analytics toolkit. Anthropic's Claude Code, for example, is an agentic coding assistant that works from the command line, an IDE, or a desktop app, reading a business's existing codebase and data pipelines, writing and running scripts, and automating repetitive tasks such as building a new data pipeline, cleaning a dataset, or connecting a source system to a reporting layer. Because it works from natural language instructions rather than requiring every task to be scoped as a formal development project, it lowers the barrier for building the smaller, one-off automations that traditionally fell through the cracks between IT and the business.
Broader AI models are also being layered on top of existing dashboards and reports, used to answer ad hoc questions in plain English, summarize a report before a meeting, or surface an anomaly in a dataset that a person might not have thought to look for. This does not replace a BI platform. It sits alongside one, handling the custom scripting, automation, and natural-language querying that a dashboard alone was never designed to do.
The integration layer behind the dashboard
Choosing a BI platform is only part of the picture. A dashboard is only as good as the data feeding it, and most of the challenges described above are really integration problems wearing a reporting disguise.
This is where iPaaS and workflow automation platforms such as:
- n8n,
- Boomi,
- Celigo,
- MuleSoft,
- Workato, and
- Jitterbit do the less visible but equally critical work of connecting core systems like NetSuite, QuickBooks, Salesforce, and e-commerce platforms so that a BI tool is working from clean, consistent, and current data rather than another set of manual exports.
Core Benefits of Getting This Right
Industry surveys consistently link stronger business intelligence maturity to measurably better outcomes. Organizations with more advanced BI capability report significantly faster decision-making and materially higher returns on their analytics investment compared to less mature peers, and the proportion of executives using dashboards for daily decisions has climbed sharply in recent years as real-time and self-service analytics have become mainstream.
Faster, more confident decisions
Consolidated, near real-time data lets leaders act on what is happening now rather than what happened last month. A pricing change, a supply disruption, or a shift in demand can be identified and acted on within days rather than months.
Improved accuracy and trust
Automated pipelines connected directly to source systems remove much of the human error inherent in manual, spreadsheet-based reporting. When every department works from the same governed dataset and the same metric definitions, arguments about whose numbers are correct largely disappear.
Cost efficiency and reclaimed time
Self-service analytics and automated reporting have been shown to significantly cut report generation backlogs, freeing skilled staff to spend their time interpreting results and advising the business rather than formatting spreadsheets.
A genuine competitive edge
Predictive and prescriptive analytics, now used by a majority of larger enterprises for forecasting and scenario planning, allow a business to anticipate demand, flag customers at risk of churn, and identify its most profitable products or services before a competitor does.
Scalability as the business grows
A well-designed analytics and reporting layer is built to handle growing data volumes and increasing complexity, whether that means new entities, currencies, or product lines, without a proportional increase in headcount.
How Versich Can Help
Versich works with businesses to close the gap between the data they already have and the advanced analytics and streamlined reporting described above, combining Power BI consulting with the underlying systems and integrations that keep it fed with reliable data.
- Power BI consulting and dashboard design, tailored to the business rather than delivered as generic templates, across sectors including financial services, SaaS, legal, and professional services.
- NetSuite consulting and managed services, including SuiteAnalytics and financial reporting configuration, so that reporting reflects how the business actually runs on its ERP rather than requiring a manual workaround.
- QuickBooks integration services, connecting financial data into a wider reporting and analytics layer rather than leaving it isolated in its own system.
- Workflow automation and iPaaS implementation using n8n, Boomi, Celigo, MuleSoft, Workato, and Jitterbit, to connect NetSuite, QuickBooks, Salesforce, and other core systems so that dashboards are working from current, reconciled data rather than manual exports.
- Ongoing managed services, so that as the business grows, adds entities, or changes systems, the reporting layer is maintained and extended rather than left to quietly break down.
The right combination of tools and integrations depends on the systems already in place, the complexity of the business, and its current reporting maturity. Versich's role is to assess that starting point and build toward a reporting and analytics environment that the business can trust and scale with.
Getting Started
Businesses considering a move toward advanced analytics and streamlined reporting do not need to overhaul every system at once. A practical starting point is to identify the two or three reports that consume the most manual effort or carry the most business risk if inaccurate, and to automate and modernize those first. From there, the same governed data model can be extended to cover additional departments and use cases over time.
What consistently holds true across industries is that businesses which invest in this capability make faster decisions, operate more efficiently, and are better positioned to respond to change than those still relying on manual, spreadsheet-driven reporting.