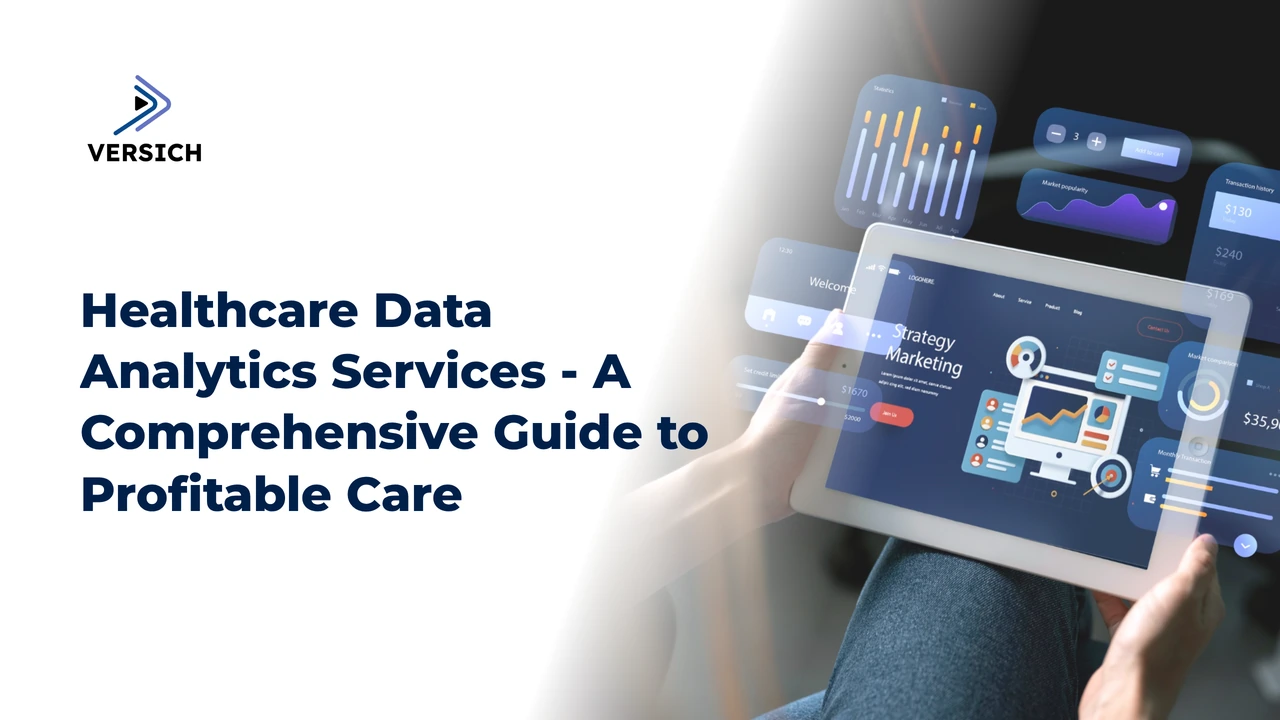
The healthcare sector is the most information-rich industry globally, yet it also stands out for being among the slowest to turn this data into actionable insights. RBC Capital Markets states that a single hospital produces about 50 petabytes of data annually from sources like EHRs, imaging, claims, devices, genomics, and patient engagement platforms. Despite this, more than 95% of the data typically doesn’t reach the people-clinicians, actuaries, or operations leaders-who need it in an actionable form.
At Versich, our healthcare analytics consultants have managed projects involving data analytics, Power BI, Looker Studio, automation, and data integration across various healthcare and medical services organizations. We usually focus on linking disjointed systems, automating reporting processes, and creating dashboards that clinical, operational, finance, and leadership teams can regularly utilize.
In this article, we’ll delve into what healthcare data analytics services are, the primary types of analytics, the most beneficial services for healthcare organizations, common obstacles during implementation, and tips on selecting the right analytics partner.
What Are Healthcare Data Analytics Services?
Healthcare data analytics services aim to transform the vast amount of data generated within a healthcare organization into a useful resource. This process encompasses gathering, organizing, integrating data from different systems, identifying patterns, and presenting the information in a way that supports informed decision-making.
The data originates from various functions within the organization, including clinical information about patients, operational metrics, financial statistics, appointment data, claims processing, workforce management, and even marketing efforts. By aggregating this information, healthcare professionals can more easily answer four vital questions: what is currently happening, why it is happening, what is likely to occur next, and what actions should be taken in response.
However, a key area that must not be overlooked is data privacy. Given that healthcare data is some of the most sensitive information individuals possess, all analytics efforts need robust governance from the outset. In the U.S., compliance with HIPAA regulations is essential for protecting health information. In Europe, health data falls under GDPR's special category, requiring stringent measures for storage, sharing, and usage. Getting this aspect right makes analytics a valuable asset; getting it wrong can result in severe backlash.
Types of Healthcare Analytics
Descriptive Analytics - What Happened?
Descriptive analytics focuses on the past. It reveals what has actually occurred by harnessing existing data, allowing for insights into past performance.
In a healthcare environment, this might include metrics such as the number of patients treated, appointment attendance rates, readmission statistics, treatment outcomes, staff workload, claim processing, equipment usage, and completion of scheduled visits.
The goal is straightforward: to provide teams with a transparent and reliable view of where they stand and how things have progressed. This information typically manifests as live dashboards, regularly scheduled reports, and key performance indicators (KPIs) that everyone can easily access.
Diagnostic Analytics - Why Did It Happen?
Where descriptive analytics tells you what took place, diagnostic analytics explains why it happened. This layer allows organizations to dive deeper into performance changes rather than just acknowledging them.
For instance, imagine a clinic that notes a decline in patient attendance. On its own, that statistic lacks context. Diagnostic analytics enables an organization to dissect the same data in multiple ways-by location, by clinician, by appointment type, by referral source, or by patient demographic-revealing patterns previously hidden in the overall metric.
This leads to a more intelligent discussion. Rather than stating "attendance has dropped," a manager can articulate, “Follow-up appointment attendance has decreased significantly at two locations, starting right after we halted sending reminder texts.” This presents a clear issue that can be addressed.
Predictive Analytics - What Is Likely to Happen?
Predictive analytics involves forecasting future scenarios by learning from historical data and current trends. It offers insights into what may occur next.
This creates several practical applications in healthcare. You can project patient demand, identify patients who may be at risk of readmission, proactively plan for medical equipment servicing, detect early signs of disengagement in patients, and make better capacity planning decisions across facilities.
As an example, Versich created a set of Power BI reports for a medical device company, integrating logs from their machines to track usage over time. With this data, the client could foresee potential equipment failures, identify decreasing usage rates, and engage with customers proactively. This led to a 20% increase in service revenue alongside reduced operational costs.
Prescriptive Analytics - What Should We Do?
Prescriptive analytics goes one step further. It not only predicts what is likely to happen but also advises on the best course of action. Whether the recommendation is for a human decision-maker or a system to take automated action, this layer provides crucial guidance.
In daily healthcare tasks, prescriptive analytics can manifest in multiple forms, such as alerts sent to the appropriate inbox, suggestions for staff reallocation, clinical interventions notified to care teams, budget recommendations included in financial discussions, or workflows that autonomously execute.
Healthcare Data Analytics Dashboard Examples
Remote Patient Monitoring
A common challenge for clinicians using connected medical devices is the lack of comprehensive visibility. While they can see overall outcomes, the detailed, session-by-session data associated with device usage often remains obscured. This makes it difficult to ascertain the effectiveness of therapy, detect minor issues before they evolve into major problems, and refine treatment plans confidently.
To bridge this gap, our Microsoft Power BI consultants developed a dashboard that combines device performance and respiratory health metrics into a single interface. Clinicians can select individual patients and review each session, correlating session duration and leak rates with clinical indicators like respiration rate, AHI (Apnea-Hypopnea Index), SpO2, and tidal volume.
The dashboard is designed for interactivity, allowing clinicians to drill down into specific dates for deeper analysis or to view trends over weeks and months. This capability enhances their ability to monitor therapy consistency and identify deviations in respiratory patterns, leading to more informed clinical decisions.
Patient Engagement Analytics
For healthcare organizations managing remote monitoring programs, patient engagement presents a significant blind spot. Monitoring daily use of connected devices and ensuring the continuous flow of data can be challenging. Without this information, identifying disengaged patients or devices that have stopped transmitting data becomes a perplexing task.
Our dashboard aims to resolve this issue by providing a live overview of patient engagement and device activity metrics. It tracks compliance levels and data transmission patterns over time, allowing healthcare teams to see trends and potential drop-offs.
Data can be analyzed by categories like device manufacturer, mode, and patient age group, helping identify whether lower engagement is linked to particular devices or patient demographics. Activity windows of 365, 90, 60, and 30 days are displayed side-by-side, making it simple to distinguish between a temporary dip and genuine disengagement.
Population Health and Risk Monitoring
Healthcare teams often deal with the challenge of fragmented patient data, which can complicate overall management. Information may come from clinic visits, apps, and lab results, making it difficult to gauge the well-being of a patient population, particularly those with chronic conditions.
To alleviate this, our Tableau consulting team developed a dashboard that aggregates clinical data captured via a mobile app, presenting a unified, real-time perspective on patient populations. This dashboard allows healthcare professionals to see how patients are distributed based on significant health indicators.
By focusing on condition-specific metrics, teams can keep track of overall health, identify high-risk patients, and monitor shifts in patient status. Segmented views enable side-by-side comparisons of patient groups, ensuring that resources are allocated to the areas of greatest need.
Care Scheduling Analytics
In fast-paced settings like hospitals or care homes, it can be challenging to manage the daily flow of care. Are residents receiving the medical visits they should? Did anyone miss an appointment that needs follow-up? When answers are scattered across logs, spreadsheets, and memory, it often leads to missed visits and disrupted care.
To clarify this process, our Business Intelligence consulting team developed a solution that centralizes care scheduling and patient activities into a unified view. At a glance, this reveals the percentage of residents who attended their essential medical appointments compared to those who did not.
This high-level overview includes monthly trends, allowing teams to see how participation stats shift over time and spot periods of declining engagement. Filters by ward, unit, and time period provide detailed insights into specific areas of the facility, helping to surface any operational issues affecting care.
Overtime Cost Analytics
Healthcare organizations frequently struggle with managing overtime costs while ensuring patient coverage. Due to varying demand and staffing challenges, overtime can quickly become a substantial expense, and without clear visibility, it's tough to pinpoint cost drivers and effectively manage budgets.
Our analytics solution enables organizations to monitor overtime spending and uncover the underlying factors contributing to those costs. We track overtime expenses monthly to identify trends and periods of increased activity.
Overtime is categorized into patient-paid overtime (PPOT) and hospital-paid overtime, providing insight into where costs are highest. Detailed breakdowns by patient allow teams to understand which cases or tasks generate extra hours, shedding light on areas of inefficiency or higher demand.
Referral Analytics
A frequent issue for hospitals is the lack of clarity around referral sources, complicating relationship management with both internal and external physicians. Referral data tends to be scattered across various systems, leading to insufficient insights regarding which departments or partners contribute to patient accumulation.
Our Looker Studio consulting team crafted an analytics solution that enables organizations to monitor referral metrics, tracking total referrals by location and allowing for comparative analysis of branch performance.
Referrals are segmented into internal and external categories to clarify contributions at both physician and partnership levels. Further categorizations by referral source and insurance type help illuminate patient demographics and dynamics in referral patterns.
Equipment Maintenance Analytics
Healthcare organizations often lack a systematic approach to understanding the condition and maintenance needs of their equipment. Without effective monitoring, maintenance tends to be reactive, resulting in unexpected breakdowns and service interruptions.
Our analytics solution facilitates tracking equipment health and maintenance needs by analyzing machinery performance and component lifespan. We evaluate usage and assess individual machine parts based on their cycles, enabling organizations to analyze performance trends over time.
Equipment components are categorized by wear levels, identifying those nearing the end of their effective lifespan. This helps in early failure detection and promotes proactive maintenance planning.
The Advantages of Healthcare Data Analytics Services
Enhanced Clinical and Operational Visibility
Effective analytics provides a transparent view of the available data. By integrating clinical, operational, and service information into user-friendly dashboards, healthcare teams can move past isolated reports and gain a cohesive understanding of ongoing situations.
In practical terms, this means connecting your data systems, establishing key KPIs, and developing dashboards that highlight trends, flag irregularities, and allow for detailed examination when necessary. Leaders can assess performance by location, service, patient type, equipment, or team without waiting for manual reports.
Accelerated Reporting with Increased Accuracy
Reporting in healthcare often involves numerous hours spent on spreadsheet manipulation, assembling data across multiple platforms, and uncertainty about accuracy. Analytics solutions alleviate these challenges by automating workflows that streamline data processing.
This typically involves API integrations, scheduled data updates, and a shared central data model that ensures dashboards can be refreshed automatically. Teams can then focus on utilizing the information rather than wrestling with reports.
Improved Resource Allocation
When you can easily visualize areas of demand, workload, and resource capacity, resource allocation becomes significantly simpler. Analytics illuminates appointment volumes, staff availability, patient flow, service demand, and equipment usage, all of which are usually handled across disparate systems.
By bringing this information together, leaders can make more rational decisions about staffing, scheduling, and service planning based on factual data rather than intuition.
Enhanced Compliance and Audit Preparedness
Analytics tools can greatly ease compliance demands. By building records, audit trails, and dashboards from the start, organizations ensure that their data is consistently up to date.
This involves organizing evidence, automating data capture processes, and making it easy for stakeholders to spot any missing documents or overdue tasks. If an audit occurs, the relevant information is readily accessible.
Challenges in Implementing Healthcare Data Analytics Services
Data Privacy and Security
Given the sensitivity of healthcare data, any analytics solution must prioritize data protection from day one. This includes implementing stringent access controls, clear permission settings, and data encryption as necessary. The importance of compliance is magnified under regulations like HIPAA in the U.S. and GDPR in Europe, which treat health data with heightened care.
Disjointed Systems
Many healthcare organizations utilize a patchwork of tools that aren’t equipped to communicate effectively. This leads to repeated data entries, discrepancies across reports, and employees often spending significant time reconciling information manually. Until these systems are properly connected, the analytics process will remain severely hampered.
Inconsistent Data Quality
Even with data consolidated, it may not always be reliable. Issues such as missing fields, inconsistent definitions, duplicate records, invalid timestamps, and free-text annotations can degrade data quality. Without rigorous cleaning and governance, dashboards may fail to present accurate information.
Low Dashboard Usage
Dashboards are only useful if they are actively used. Adoption can plummet if dashboards attempt to cover too much ground, fail to align with actual workflows, or address irrelevant questions. Functional dashboards must center around significant decisions rather than unnecessary metrics.
Limited Internal Analytics Expertise
Numerous healthcare organizations struggle with limited time or technical skills for robust analytics development. This can lead to sluggish project timelines and fragile reports that are easily disrupted. A capable analytics partner should leave behind comprehensive documentation and train users to maintain the system effectively.
How to Select a Healthcare Data Analytics Service Provider
Look for Relevant Healthcare and Regulated Experience
It's essential to choose a provider knowledgeable about sensitive data management, operational efficiencies, and the importance of rigorous reporting. They may not need to have utilized your specific system previously, but they should demonstrate experience across various healthcare services or in regulated contexts.
Prioritize Data Integration Skills
Successful analytics projects often hit roadblocks during integration. Your provider should possess comfort with APIs, SQL databases, data modeling, Power BI, Looker Studio, Tableau, Microsoft Fabric, Azure, SharePoint, and other tools that connect various data sources.
Request Measurable Outcomes
A competent partner should be able to outline tangible changes post-implementation, such as reduced reporting time, improved accuracy, faster decision-making, increased revenue, lowered costs, or bridges closed in compliance gaps. If they cannot provide evidence of outcomes, it’s wise to proceed with caution.
Verify Governance and Security Practices
Sound analytics demands a framework of sensible governance. Inquire about how your provider manages permissions, user roles, sensitive data, documentation, audit trails, and secure data refreshes. The responses should indicate thoughtful planning rather than hasty solutions.
Choose Customized Solutions Over Generic Templates
Each healthcare organization has its unique operations. While templates can offer a helpful starting point, dashboards should cater to your specific needs, KPIs, workflows, and decision-making requirements.
Ready to Develop Healthcare Data Analytics Services?
Practical, secure analytics tied to genuine decisions produce the best outcomes. Versich collaborates with healthcare organizations to integrate their data, automate the reporting processes that consume valuable time, and create dashboards their teams can fully rely on.