
Article focus: portfolio analytics, leasing and occupancy, property operations, finance, investment performance, development reporting, sustainability and the selection of modern BI platforms.
How Power BI, Tableau, Qlik Sense, Zoho Analytics and Oracle Analytics Cloud help real estate businesses improve portfolio visibility, leasing, finance, property operations and investment performance.
Introduction
Real estate businesses generate data from every lease, tenant interaction, property inspection, maintenance request, rent payment, development project and investment decision. Yet this information is often spread across property management systems, accounting platforms, customer relationship management tools, spreadsheets, construction applications and market data providers. When these systems do not communicate effectively, leadership teams struggle to obtain a reliable view of portfolio performance.
Real Estate Business Intelligence solves this problem by bringing financial, operational, leasing, tenant and market data together. Business Intelligence platforms transform raw records into interactive dashboards, automated reports and decision-ready insights. Instead of waiting for month-end spreadsheets, executives, asset managers, property managers, finance teams and investors can monitor performance as it develops and investigate the factors affecting results.
Tools such as Microsoft Power BI, Tableau, Qlik Sense, Zoho Analytics and Oracle Analytics Cloud can support organizations across residential, commercial, industrial, retail, hospitality and mixed-use real estate. The value does not come from attractive charts alone. It comes from creating a trusted data foundation that helps the business improve occupancy, control operating costs, protect cash flow, evaluate investments and maximize the value of each asset.
What Is Real Estate Business Intelligence?
Real Estate Business Intelligence is the process of collecting, integrating, analyzing and visualizing information from across a real estate organization. It converts disconnected data into a consistent view of properties, leases, tenants, projects, expenses, valuations and investments.
A property company may have lease and tenant information in a property management platform, revenue and expense data in an ERP system, opportunities in a CRM, maintenance activity in a facilities system and project costs in construction software. Analysts may also use market rent data, demographic information, interest rates and comparable transactions. Without a Business Intelligence layer, teams frequently export reports from each application and manually combine them in Excel. This process is time-consuming, difficult to audit and vulnerable to inconsistent definitions.
A well-designed BI solution standardizes the data and allows decision-makers to answer questions such as: Which properties are producing the strongest net operating income? Where are lease expirations creating risk? Which tenants have outstanding balances? How do actual operating expenses compare with budget? Which development projects are exceeding cost or schedule? What is the return on each asset, market or investment strategy? Which maintenance issues are driving tenant complaints or avoidable costs?
The objective is not to replace the source systems. The objective is to connect them and create a reliable analytical environment where users can move from a portfolio summary to the transaction or operational detail behind a result.
Why Real Estate Organizations Need Business Intelligence
Real estate performance is influenced by many connected factors. Occupancy affects rental income. Lease terms influence future cash flow. Property condition affects tenant retention and capital expenditure. Interest rates affect financing costs and valuations. Market demand changes by geography, asset class and tenant segment. Because these factors interact, isolated reports rarely provide enough context for good decisions.
Business Intelligence gives leadership teams a shared view of performance. Executives can monitor the overall portfolio, finance can reconcile revenue and expenses, asset managers can evaluate returns, property managers can review operational issues and leasing teams can track pipeline activity. When everyone works from consistent definitions, meetings become less focused on reconciling numbers and more focused on action.
BI is particularly important for organizations managing multiple properties, entities or investment vehicles. A single building may be easy to understand through local reports. A portfolio of dozens or hundreds of assets requires standard measures, consolidated reporting and the ability to compare properties fairly. Business Intelligence enables that comparison while preserving the detail required to understand local conditions.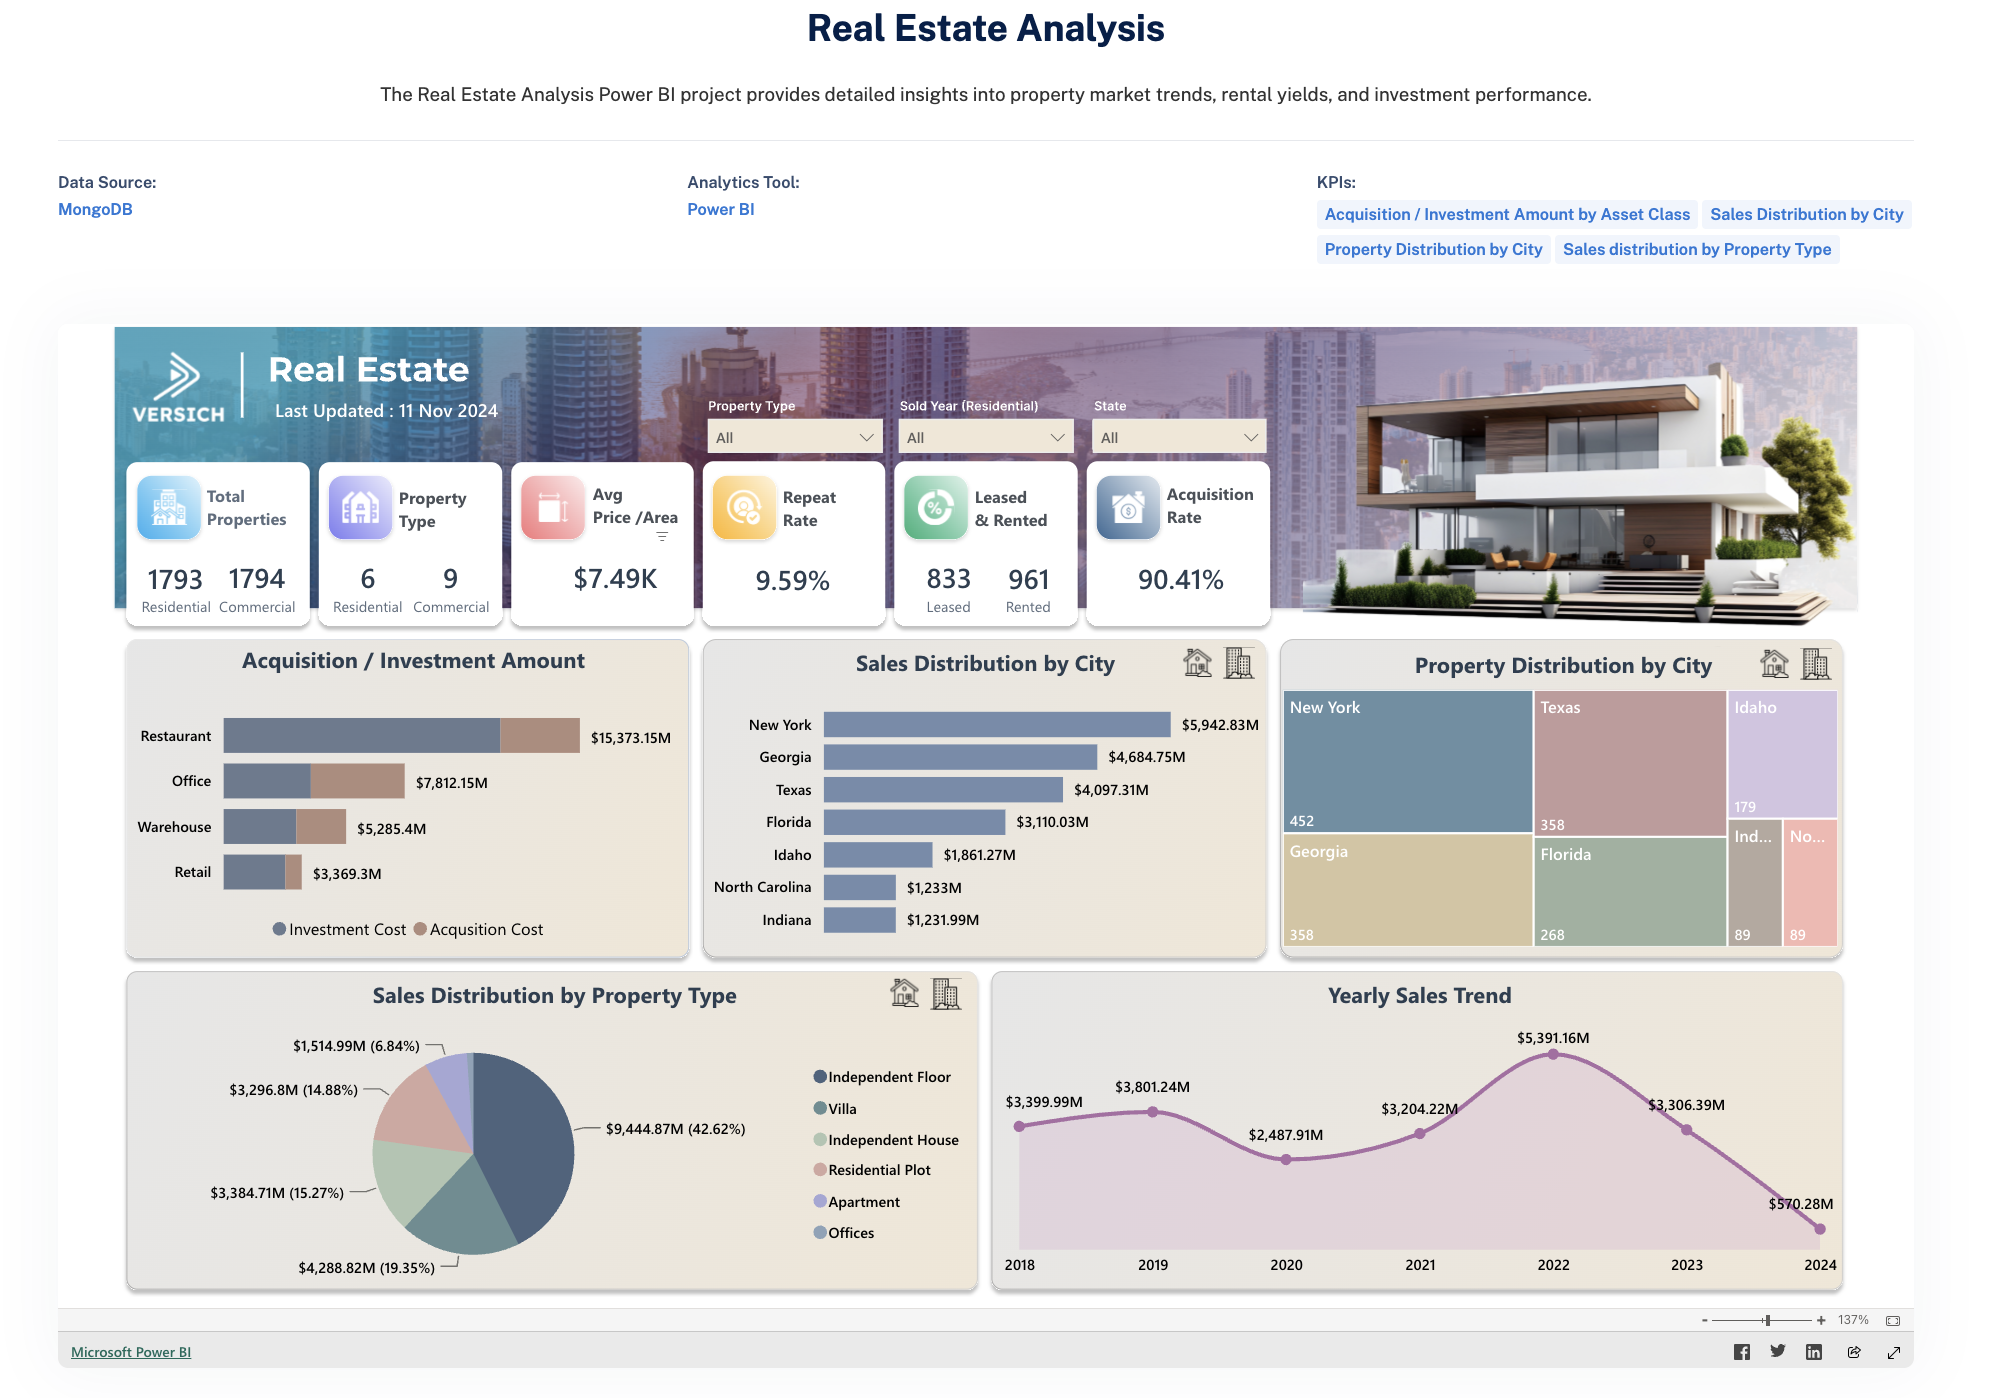
Here’s a Sample Real Estate Dashboard, Explore the interactive dashboard here
Building a Unified Real Estate Data Foundation
The quality of every dashboard depends on the quality of the data behind it. Real estate organizations often operate with a combination of modern cloud applications, legacy property systems and spreadsheets created for specific assets or investment teams. Before dashboards are built, the data must be connected, cleaned and aligned.
Common real estate data sources include property management and lease administration platforms, accounting and ERP systems like NetSuite, Quickbooks, Odoo (very popular amongst Real Estate companies), CRM applications like Salesforce, Zoho CRM, maintenance and facilities systems, construction and project management tools, budgeting and forecasting applications, investor reporting platforms, geographic information systems, utility and sustainability data, market research providers and locally maintained spreadsheets.
A modern architecture may use APIs, database connectors, cloud storage, integration platforms and a centralized data warehouse or lakehouse. The analytical model then creates consistent definitions for properties, units, tenants, leases, funds, legal entities, markets, asset classes and accounting periods.
Master data is especially important. The same building may appear under different names in accounting, property management and project systems. Tenant names may vary across leases and receivables. Property hierarchies may change as assets are acquired, sold or reorganized. A strong BI model resolves these differences and preserves historical reporting so portfolio results remain accurate over time.
Governance should also define the source of truth for each measure. For example, executed lease dates may come from the lease administration system, rent collections from the accounting platform and market rent assumptions from the budgeting model. Establishing ownership avoids conflicting versions of occupancy, revenue or valuation.
Business Intelligence Use Cases for Real Estate
- Portfolio Performance and Executive Reporting
Portfolio dashboards provide a consolidated view of assets, markets, entities and investment vehicles. Executives can monitor occupancy, rental income, net operating income, cash flow, capital expenditure, valuation and total return. Results can be compared with budget, forecast, prior year and underwriting assumptions.
Interactive dashboards allow users to start with a portfolio-level summary and drill into a region, property, unit, tenant or general ledger transaction. This is more useful than a static management pack because decision-makers can investigate unusual results during a meeting without waiting for another report.
For multi-entity organizations, BI can also separate operational performance from financing, ownership and currency effects. This helps leadership understand whether a change in profit is caused by property operations, debt costs, acquisitions, disposals or foreign exchange.
- Leasing, Occupancy and Tenant Analytics
Leasing performance is central to the value of income-producing real estate. BI dashboards can track physical occupancy, economic occupancy, vacant units, lease commencements, renewals, expirations, break options, rent-free periods and weighted average lease expiry.
Leasing teams can review prospects and negotiations by property, market, unit type, broker and stage. Asset managers can identify upcoming expiration concentrations and model the effect of renewals, vacancies or changes in market rent. Dashboards can highlight leases that require action within the next 30, 60, 90 or 180 days.
Tenant analytics can combine lease information, payment history, service requests and satisfaction data. This helps the organization identify high-value tenants, retention risks and opportunities to improve service. It also supports more informed negotiations because teams can see the full relationship rather than reviewing lease terms in isolation.
- Rent Collection, Accounts Receivable and Cash Flow
Cash flow visibility is critical for property owners and managers. Real estate BI can monitor billed rent, cash receipts, arrears, unapplied payments, security deposits, concessions and bad debt. Dashboards can show outstanding balances by tenant, property, aging category and responsible manager.
Finance and property teams can use exception reporting to focus on material or overdue items instead of reviewing every account manually. Collection trends can be compared across properties and tenant segments, helping management understand whether issues are isolated or systemic.
Forward-looking cash flow reports can combine lease schedules, expected collections, operating expenses, debt service and planned capital expenditure. This gives treasury and investment teams a clearer view of liquidity requirements and potential funding gaps.
- Property Operations, Maintenance and Facilities Management
Property operations generate large volumes of service and maintenance data. BI dashboards can track work orders, response times, completion times, contractor performance, recurring faults, preventive maintenance and cost per unit or square foot.
Managers can identify buildings with unusually high repair costs or repeated equipment failures. They can compare planned and reactive maintenance, analyze whether service-level agreements are being met and determine which vendors provide the best combination of cost and performance.
When maintenance data is connected with tenant satisfaction and lease renewal information, the business can see whether operational issues are affecting retention. This creates a stronger case for targeted capital improvements and helps prioritize spending based on business impact rather than anecdotal requests.
- Financial Reporting, Budgeting and Expense Control
Real estate finance teams often prepare detailed reporting by property, entity, fund, department and account. Business Intelligence automates consolidation and provides flexible views of revenue, operating expenses, net operating income, management fees, debt costs and capital expenditure.
Budget-versus-actual dashboards can identify variances by property and expense category. Users can drill into utilities, repairs, insurance, property taxes, security, cleaning or professional fees. This helps asset and property managers understand whether a variance reflects timing, an isolated event or a structural cost issue.
BI can also connect accounting results with operational drivers. A rise in utility expense can be analyzed against occupancy, weather, floor area or equipment performance. Cleaning costs can be compared with tenant density and service scope. This operational context makes financial analysis more actionable.
- Investment, Asset Management and Valuation Analytics
Investment teams need to understand both current performance and future return. BI platforms can combine actual property results with underwriting assumptions, valuations, debt terms and market data. Dashboards can track internal rate of return, equity multiple, cash-on-cash return, capitalization rate, loan-to-value and debt service coverage.
Asset managers can compare actual net operating income with acquisition or business plan assumptions. They can identify assets that are ahead of plan, behind plan or exposed to leasing, expense or financing risks. Scenario analysis can show how changes in occupancy, rent growth, exit capitalization rates or interest costs may affect value.
For funds and investment managers, BI supports reporting by investor, fund, strategy, geography and vintage. It can also improve the consistency of quarterly reporting by linking approved financial data to standardized performance measures.
- Real Estate Development and Construction Analytics
Development projects require close control of budget, schedule, contracts, commitments, change orders and funding. BI dashboards can consolidate information from project management, procurement and finance systems to show the current position of each project.
Teams can monitor original budget, approved changes, committed costs, actual costs, forecast at completion, contingency usage and cost variance. Schedule reporting can highlight delayed milestones, dependencies and contractor performance. Development leaders can compare projects and identify recurring causes of budget or schedule overruns.
When project data is connected with leasing and investment assumptions, management can assess whether delays will affect opening dates, rental income, financing requirements or expected returns. This creates a more complete view than construction reporting alone.
- Market, Location and Acquisition Analytics
Real estate decisions are highly dependent on location. BI platforms can combine internal portfolio data with market rents, vacancy rates, demographics, employment, population growth, transportation, foot traffic and comparable transactions.
Map-based dashboards help investment teams identify geographic concentrations, underserved markets and performance differences across neighborhoods. Acquisition teams can compare potential assets with the existing portfolio and underwriting criteria. Leasing teams can evaluate whether asking rents are aligned with local conditions.
Location analytics is valuable across asset classes. Retail operators can analyze trade areas and customer demand. Industrial investors can assess logistics access and supply. Residential teams can review affordability, household formation and local amenities. Office investors can compare employment trends, availability and tenant demand.
- Sustainability, Energy and ESG Reporting
Property energy consumption and environmental performance are increasingly important for operating cost control, compliance, financing and investor reporting. BI dashboards can track electricity, gas, water, waste, carbon emissions and energy intensity by property and period.
Managers can identify buildings with unusually high consumption, measure the impact of efficiency projects and compare performance with targets. Data can be normalized for occupancy, weather and floor area so properties are assessed more fairly.
A reliable BI framework also supports environmental, social and governance reporting by maintaining traceable calculations and consistent property-level data. This is more sustainable than collecting information manually at each reporting deadline.
Comparing Business Intelligence Tools for Real Estate
Power BI is a strong option for real estate organizations that want interactive dashboards, financial reporting, operational analytics and integration with the Microsoft ecosystem. It can connect to property systems, ERP platforms, CRM applications, databases, spreadsheets, cloud services and market data sources.
Power BI is particularly effective for portfolio reporting because its data model can standardize measures across properties, entities, leases and periods. Users can review executive scorecards, leasing activity, property profitability, receivables, capital projects, investment performance and sustainability metrics within a consistent reporting environment.
Organizations evaluating the platform can review Versich's Power BI portfolio for examples of dashboard design and reporting capabilities. Versich also provides Power BI consulting services covering requirements, data integration, modeling, DAX development, dashboard delivery, deployment and governance.
- Tableau
Tableau is well known for visual exploration and data storytelling. It can be a strong choice for real estate analysts who want to investigate market, property and investment data from multiple angles.
Investment teams may use Tableau to compare markets, map portfolio exposure, analyze acquisition opportunities and present research. Property and leasing teams can create interactive views of occupancy, tenant mix and unit availability. Tableau's visual flexibility can support polished executive and investor presentations.
As with any self-service platform, governance is essential. Shared data sources and approved KPI definitions should be established so users do not create conflicting calculations for occupancy, net operating income or return.
- Qlik Sense
Qlik Sense uses an associative analytics model that allows users to explore relationships across data without following a fixed drill path. This can be valuable when real estate teams want to understand how properties, tenants, leases, expenses, markets and investment outcomes are connected.
For example, an analyst could select a market and immediately see the related properties, lease expirations, tenant sectors, operating expenses and investment returns. Qlik can support guided dashboards and self-service exploration when the data model is designed carefully.
The platform may suit organizations that value flexible discovery and want users to investigate exceptions beyond standard management reports.
- Zoho Analytics
Zoho Analytics can be suitable for small and mid-sized property companies seeking cloud-based reporting with a relatively straightforward deployment model. It offers connectors, data blending, dashboards and scheduled reporting without requiring a large enterprise analytics program at the outset.
Property managers and growing real estate businesses may use Zoho Analytics to combine CRM, accounting, leasing and operational data. It can support management reporting, occupancy analysis, collections and sales pipeline dashboards.
As requirements become more complex, organizations should evaluate whether the platform can support their desired data volumes, governance, security and modeling needs.
- Oracle Analytics Cloud
Oracle Analytics Cloud is a strong consideration for real estate organizations that already use Oracle applications, databases, ERP platforms or cloud infrastructure. It supports enterprise reporting, governed semantic models, visualization, data preparation and augmented analytics.
Large property groups, developers and investment organizations can use Oracle Analytics Cloud to analyze finance, procurement, projects, workforce and asset data within an Oracle-centered environment. It is particularly relevant where Oracle Fusion Cloud ERP, Enterprise Performance Management or Oracle databases form a major part of the technology landscape.
Implementation planning should address data architecture, security, semantic modeling and the user experience required by finance, operations and investment teams.
Choosing the Right BI Platform
There is no single best BI tool for every real estate organization. The decision should be based on the questions the business needs to answer, the systems already in place and the level of governance required.
Key considerations include the number and complexity of data sources, portfolio size, reporting requirements, geographic mapping, financial consolidation, mobile access, security by property or fund, licensing cost, internal technical skills, scalability and the need to share information with investors, tenants or external partners.
A growing property manager may prioritize rapid deployment and ease of use. A global investment manager may need enterprise governance, a centralized warehouse and detailed access controls. A Microsoft-centered organization may find Power BI practical, while an Oracle-centered organization may prefer Oracle Analytics Cloud. The technology should support the operating model rather than force the business into a reporting approach that does not fit.
Key Real Estate KPIs to Track
A successful BI solution should focus on measures that support decisions. Core property metrics may include physical occupancy, economic occupancy, rent per square foot, lease renewal rate, tenant retention, vacancy duration, arrears, bad debt, operating expense per square foot and net operating income margin.
Asset and investment teams may track capitalization rate, internal rate of return, equity multiple, cash-on-cash return, loan-to-value, debt service coverage, valuation movement and actual performance against underwriting. Development teams may track committed cost, forecast at completion, contingency usage, schedule variance and leasing progress.
The most useful dashboards connect these metrics. Occupancy should be analyzed alongside rental rates and incentives. Net operating income should be linked to its revenue and expense drivers. Investment return should be evaluated against the business plan and risk exposure. Isolated KPIs can be misleading when they are not placed in context.
A Practical Real Estate BI Implementation Roadmap
A Real Estate Business Intelligence project should begin with decisions, not dashboards. The first step is to identify the business outcomes that matter most, such as improving occupancy, reducing arrears, controlling property costs, monitoring development risk or standardizing portfolio reporting.
Next, translate those outcomes into specific questions and approved KPI definitions. Review the systems that contain the required data, how often the data changes and who owns its quality. This discovery stage often reveals duplicate property records, incomplete lease information, inconsistent account mappings and manual adjustments that need to be addressed.
The third step is to design the integration and data model. Decide whether information will be loaded into a data warehouse, lakehouse or other centralized platform, or whether some sources can be queried directly. Create standard dimensions for property, unit, tenant, lease, entity, fund, market and time.
The fourth step is to deliver a focused first release. A high-value starting point may be an executive portfolio dashboard, leasing and occupancy reporting, rent collections or budget-versus-actual analysis. A targeted release creates visible value and allows the data model to be validated before the scope expands.
The fifth step is reconciliation and user testing. Finance, asset management, property management and investment teams should confirm that totals and calculations match approved reports. Differences must be explained before dashboards become the official reporting source.
Finally, establish governance and ongoing support. Define ownership of KPIs, access rules, refresh monitoring, release management and a process for handling source-system changes. BI is an ongoing capability, not a one-time dashboard project.
Common Real Estate BI Challenges
The most common challenge is inconsistent data across systems. Property names, unit codes, tenant identifiers and entity structures may not align. Acquisitions and disposals can also complicate historical reporting. These issues should be resolved in the data model rather than hidden inside individual dashboards.
Another challenge is unclear metric ownership. Different teams may calculate occupancy, net operating income or return differently. Business Intelligence cannot solve this through technology alone. The organization must agree on definitions and document them.
User adoption can be difficult when dashboards contain too much information or do not match existing workflows. Reports should be designed around user responsibilities, highlight exceptions and make it easy to move from a summary to the underlying detail.
Performance and maintenance also require attention. As properties and data volumes increase, models may need optimization. APIs can change, refreshes can fail and business hierarchies can be reorganized. Our Power BI support services can help organizations maintain dashboards, resolve data refresh issues, improve performance and extend existing reporting solutions.
How We Support Real Estate Companies With Business Intelligence
Versich helps organizations design and implement Business Intelligence solutions that connect financial, operational, leasing, project and investment data. For real estate companies, this may involve integrating property management systems, ERP platforms, CRM applications, construction tools, budgeting systems, market data and spreadsheets into a unified analytical environment.
The work extends beyond dashboard design, we provide reliable reporting requires structured data models, clear definitions, secure access, reconciliation and a deployment approach that supports ongoing change.
We also provide Business Intelligence strategy and requirements gathering, Power BI dashboard design and development, data integration, financial and operational modeling, portfolio and property reporting, leasing and occupancy analytics, budget-versus-actual analysis, investment reporting, performance optimization, governance and ongoing support.
Organizations that need additional delivery capacity can hire our Power BI developers for dashboard development, DAX, Power Query, data modeling, integrations and reporting enhancements. Examples of the types of reporting solutions delivered can also be reviewed through our Power BI case studies.
Turning Real Estate Data into Action
Real estate organizations already possess valuable data. The challenge is connecting it, validating it and making it useful to the people responsible for properties, tenants, projects and investments.
Business Intelligence provides a clearer view of occupancy, income, expenses, cash flow, leasing risk, property operations, development progress and investment return. Power BI, Tableau, Qlik Sense, Zoho Analytics and Oracle Analytics Cloud can all support this objective when the platform is matched to the organization's needs and backed by a reliable data foundation.
The greatest value comes when dashboards do more than report what happened. They should help teams identify why performance changed, where risk is developing and what action should be taken next. For property owners, managers, developers and investors, that level of visibility can improve operational discipline, strengthen decision-making and create more sustainable portfolio value.
Build your real estate analytics platform with Versich Connect property, finance, leasing and investment data through secure, scalable Power BI reporting and ongoing support. Send us a Message! |


