What Are Small Business Dashboards?
Small businesses make decisions every day about pricing, cash flow, customers, inventory, staffing and growth. However, the information needed to make those decisions is often spread across accounting software, spreadsheets, payment platforms, customer relationship management systems, e-commerce stores and marketing tools.
A business owner may know that sales increased, but not whether profit improved. A sales manager may see a growing pipeline, but not whether leads are converting. A finance team may understand the current bank balance, but not the cash expected over the next 30, 60 or 90 days.
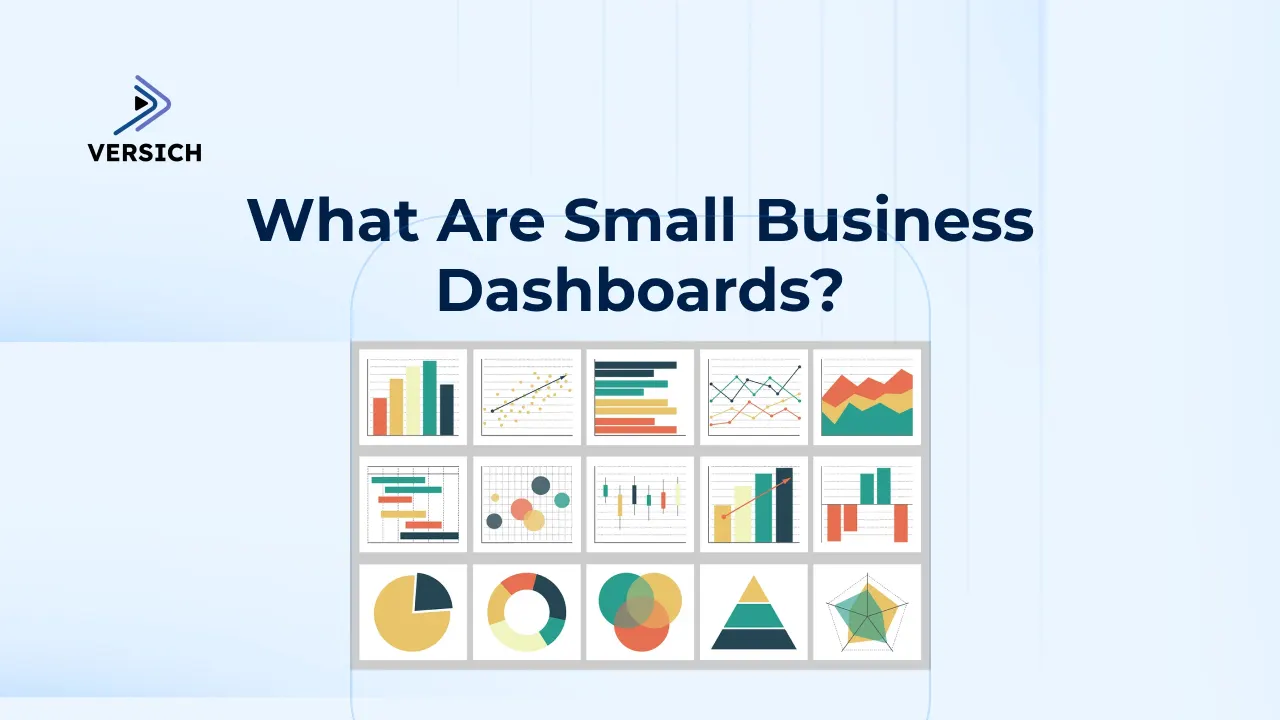
Small business dashboards solve this problem by bringing important data into one clear, visual view. Instead of opening several systems and manually combining reports, business owners and managers can monitor key performance indicators, compare results with targets and investigate problems from a single dashboard.
Business Intelligence platforms such as Microsoft Power BI, Tableau, Qlik Sense, Zoho Analytics and Oracle Analytics Cloud can connect data from different parts of a business and present it through interactive charts, tables, scorecards and alerts.
The result is not simply better reporting. It is faster decision-making, clearer accountability and a stronger understanding of what is driving revenue, cost and profitability.
How They Work
A dashboard typically sits above the systems a business already uses. Data is collected from those systems, cleaned, organized and transformed into consistent metrics. The dashboard then displays those metrics in a way that is relevant to the user.
For example, a company may use QuickBooks or Xero for accounting, HubSpot or Salesforce for customer management, Shopify for online sales, Google Ads for marketing and Excel for budgets.
A Business Intelligence solution can connect these sources and create a unified view of financial and operational performance.
Some dashboards connect directly to source applications. Others use APIs, scheduled data imports, cloud storage or a data warehouse. The right architecture depends on the number of systems, the volume of data, the required refresh frequency and the level of security or governance needed.
Regardless of the technology, the process normally includes four stages:
- Collecting data from the relevant systems.
- Cleaning and standardizing the information.
- Calculating agreed performance measures.
- Presenting those measures through dashboards and reports.
Each stage matters. Attractive visuals cannot compensate for incomplete data or inconsistent definitions.
Why Small Businesses Need Dashboards
Faster and More Confident Decisions
Small businesses often operate with limited time and management capacity. Leaders cannot spend hours combining spreadsheets whenever they need an answer.
A dashboard gives them quick access to current performance and makes it easier to identify what requires attention.
One Version of the Numbers
Different teams may calculate the same metric in different ways. Sales may report gross order value while finance reports recognized revenue. Marketing may count every lead while sales counts only qualified opportunities.
A structured BI model creates common definitions and reduces debate over which number is correct.
Early Identification of Problems
Dashboards help reveal issues before they become more serious. Falling gross margin, overdue receivables, slow-moving inventory, rising customer acquisition costs or a weakening sales pipeline can be identified earlier when the relevant indicators are monitored consistently.
Less Manual Reporting
Manual reporting takes time and increases the risk of errors. When dashboards refresh automatically, employees spend less time copying data and more time interpreting results, investigating exceptions and improving the business.
Better Planning and Accountability
A dashboard can compare actual performance with budgets, targets, forecasts or prior periods. This makes it easier to understand whether the business is on track and who is responsible for addressing a gap.
Types of Small Business Dashboards
Sales Dashboard
A sales dashboard helps a business understand pipeline health, salesperson performance and revenue conversion. It combines activity from a CRM, quoting tool, order system and accounting platform.
The dashboard may track leads, qualified opportunities, pipeline value, expected close dates, win rate, average deal size and sales cycle length.
Managers can filter the information by salesperson, product, customer type, geography or lead source.
One of the most important benefits is visibility into future revenue. Historical financial reports explain what has already happened. A sales dashboard shows whether enough qualified opportunities exist to support the next month or quarter.
Common sales dashboard metrics include:
- New leads and qualified opportunities
- Pipeline value by sales stage
- Conversion and win rates
- Average sales cycle and deal size
- Revenue by salesperson or territory
- Forecast versus target
- Lost-deal reasons
- Inactive or delayed opportunities
Marketing Dashboard
A marketing dashboard connects campaign spending with leads, sales and customer value. This is important because impressions and clicks do not necessarily translate into profitable growth.
Small businesses can use dashboards to compare website traffic, inquiries, campaign costs, conversion rates, customer acquisition costs and revenue by channel.
This helps determine whether search advertising, social media, email, events, referrals or content marketing are producing meaningful results.
The strongest marketing dashboards connect marketing activity with CRM and financial data. Instead of stopping at the number of leads generated, the business can see which campaigns produced qualified opportunities, paying customers and repeat revenue.
Marketing dashboards may monitor:
- Website sessions and conversion rates
- Leads and opportunities by source
- Advertising spend and cost per lead
- Customer acquisition cost
- Campaign-attributed revenue
- Email engagement and form submissions
- Return on marketing investment
Here's a sample Google Analytics Dashboard
Financial Dashboard
A financial dashboard gives owners and finance teams a concise view of the company’s financial health. It can combine income statement, balance sheet, cash flow and working capital data with budgets and forecasts.
Common measures include revenue, gross profit, operating expenses, net profit, cash balance, accounts receivable, accounts payable, burn rate and budget variance.
Users can analyze results by product, customer, department, project, location or legal entity.
A financial dashboard should go beyond showing accounting totals. It should help explain why results changed. If gross margin falls, the user should be able to see whether the cause was discounting, higher supplier costs, product mix or lower employee utilization.
A small business financial dashboard may include:
- Revenue, gross profit and net profit
- Cash balance and short-term cash forecast
- Budget versus actual performance
- Accounts receivable aging and overdue invoices
- Accounts payable and upcoming obligations
- Operating expense trends
- Profitability by customer, service, project or product
See links below to interactive Income Statement and Profit and Loss Dashboards
Operations Dashboard
An operations dashboard monitors the activities required to deliver products or services.
The measures vary by business. A consulting company may track employee utilization, project margin and delivery milestones. A retailer may monitor orders, fulfillment and returns. A field service company may track appointments, response times and job completion.
Operational dashboards help managers understand capacity, productivity, delays and bottlenecks. They can compare expected performance with actual results and highlight exceptions that require action.
The dashboard should connect operational measures with financial outcomes. Completing more jobs is not automatically positive if rework, overtime or supplier costs increase. Linking activity with cost and margin provides a more useful view.
An operations dashboard may track:
- Orders received, processed and completed
- Project or job status
- Employee utilization and productivity
- Service response and completion times
- Backlog and overdue work
- Quality issues, returns or rework
- Cost and margin by job or project
Inventory Dashboard
Businesses that sell or use physical products need visibility into inventory availability, movement and value.
Too little inventory can cause missed sales and delayed delivery. Too much inventory ties up cash and increases the risk of obsolescence.
An inventory dashboard can track stock on hand, inventory value, items below reorder level, sales velocity, stockouts, days of supply and slow-moving products.
Purchasing teams can use the information to plan replenishment and review supplier performance.
When connected with sales and finance data, inventory analytics can also reveal which products generate revenue but weak margins, which items are frequently discounted and where working capital is being trapped.
Inventory dashboard metrics may include:
- Inventory quantity and value
- Reorder alerts and projected stockouts
- Inventory turnover and days on hand
- Fast- and slow-moving items
- Supplier lead times
- Purchase price trends
- Returns and damaged goods
- Inventory write-offs
- Gross margin by product or category
Here’s a link to an interactive Inventory Management Dashboard
Accounting Dashboard
An accounting dashboard gives business owners, bookkeepers and finance teams a clear view of day-to-day accounting activity. It can combine general ledger, bank, accounts receivable, accounts payable, payroll and tax information so users can monitor the accuracy and completeness of the company’s financial records.
The dashboard may track unreconciled bank transactions, overdue customer invoices, bills due, uncategorized expenses, journal entries, month-end close progress and tax obligations. This helps the business identify errors earlier, improve cash collection, complete reconciliations faster and maintain more reliable financial reporting.
Here’s an interactive Accounting Dashboard
Key Metrics for a Small Business Dashboard
The right KPIs depend on the business model, but most small businesses should combine financial results with leading operational indicators.
Financial metrics show the outcome. Leading indicators help explain what may happen next.
Example KPIs | Management question | |
Finance | Revenue, gross margin, net profit, cash balance, receivables | Is the business profitable and able to meet its obligations? |
Accounting | Unreconciled transactions, overdue invoices, bills due, close status, tax obligations | Are the books accurate, current and ready for reporting? |
Sales | Pipeline, win rate, average deal size, sales cycle, forecast | Is enough future revenue being generated? |
Marketing | Leads, conversion rate, acquisition cost, campaign ROI | Which channels create profitable customers? |
Social Media | Audience growth, reach, engagement rate, clicks, leads, attributed revenue | Which platforms and content generate engagement, leads and revenue? |
Operations | Backlog, utilization, cycle time, quality, delivery performance | Can the business deliver efficiently and at the required standard? |
Inventory | Stock level, turnover, days on hand, stockouts, product margin | Is the right inventory available without tying up excess cash? |
Business Intelligence Tools for Small Business Dashboards
Several BI platforms can be used to build small business dashboards. The best option depends on the systems already in use, reporting complexity, user skills, budget and future growth requirements.
Microsoft Power BI
Microsoft Power BI is a widely used platform for interactive dashboards, data modeling and business reporting.
It can connect to spreadsheets, databases, accounting applications, CRM systems, cloud services and many other data sources.
Power BI is particularly useful for small businesses that already use Microsoft 365, Excel, Azure or Dynamics applications. It can support simple management dashboards as well as more structured reporting environments with automated refreshes, security controls and centralized data models.
Power Query helps clean and transform data, while DAX is used to create calculations such as year-to-date sales, gross margin, customer retention and budget variance.
Reports can be shared with different users while controlling which data each person is allowed to see.
Businesses considering Microsoft’s platform can review our Power BI portfolio for examples of dashboard design and reporting capabilities.
We also provide Power BI consulting services for data integration, modeling, dashboard development and deployment.
Tableau
Tableau is known for flexible visual analysis and data storytelling. It allows users to explore information interactively and create polished visual reports.
It can suit small and growing businesses that need advanced visual exploration or have analysts who want to investigate data from multiple perspectives.
Tableau connects to spreadsheets, databases and cloud platforms, although licensing, governance and administration should be considered as usage expands.
The platform is most effective when important metrics and data definitions are standardized. Without this, different users may create separate calculations for the same business measure.
Qlik Sense
Qlik Sense supports self-service analytics through an associative data model. Users can explore relationships between information without being limited to a fixed drill-down path.
A small business may use Qlik Sense to investigate how customers, products, sales channels, regions and time periods relate to one another.
This can help reveal patterns that may be difficult to see in traditional static reports.
As with other platforms, the value depends on a well-designed data model, reliable source connections and clear ownership of KPIs.
Zoho Analytics
Zoho Analytics is a cloud-based reporting platform that can be attractive to smaller organizations seeking a straightforward way to connect and visualize data.
It includes connectors to business applications and can be used to create dashboards across sales, finance, marketing and operations.
It may be especially relevant to companies already using Zoho applications. Small businesses can start with focused dashboards and expand as reporting requirements become more mature.
Complex data integration or enterprise-wide governance may require additional architecture, but Zoho Analytics can provide an accessible starting point for many reporting requirements.
Oracle Analytics Cloud
Oracle Analytics Cloud provides enterprise-grade analytics, visualization, governed reporting and augmented analytics.
It is more likely to be considered by established or fast-growing businesses that already use Oracle applications, Oracle databases or Oracle Cloud Infrastructure.
The platform can combine finance, workforce, procurement, customer and operational data. It supports centralized semantic models and controlled access, which may be important for businesses preparing for greater reporting complexity.
For a very small company, Oracle Analytics Cloud may provide more capability than is immediately required. For a business operating within an Oracle-centered environment, however, it can become a strategic analytics platform.
Excel Dashboards
Excel is often the first dashboard tool used by a small business. It is familiar, flexible and suitable for simple analysis.
PivotTables, charts, formulas and Power Query can create useful management reporting without a separate BI platform.
However, spreadsheet dashboards can become difficult to control as the business grows. Manual file preparation, broken formulas, duplicate versions and limited security may create risk.
Excel can remain valuable for ad hoc analysis and planning, while a BI platform handles automated and widely shared reporting.
How to Choose the Right Dashboard Tool
A small business should choose a tool based on practical requirements rather than the number of visual features.
Important questions include:
- Which systems contain the data?
- How frequently must the dashboard refresh?
- How many people need access?
- Do different users need restricted views?
- Will users create their own reports or only consume approved dashboards?
- How complex are the calculations and data relationships?
- Does the company need mobile access or embedded reporting?
- Who will maintain integrations, calculations and security?
- How quickly are the business and reporting requirements expected to grow?
A company with a few simple spreadsheets may not need an enterprise analytics environment immediately.
A growing business with multiple applications, locations or departments should consider a platform that can scale without rebuilding every report from the beginning.
How to Build a Small Business Dashboard
1. Start with Business Questions
Begin by identifying the decisions the dashboard should improve.
Questions such as “Why is cash falling despite higher sales?” or “Which marketing channel produces the most profitable customers?” are more useful than a broad request to display all available data.
2. Select a Focused Set of KPIs
Choose measures that directly support the user’s responsibilities.
A business owner may need ten to fifteen summary KPIs, while a sales manager may need more detailed pipeline measures.
Avoid adding metrics simply because the data is available.
3. Identify and Assess Data Sources
Document where each KPI will come from, how often the data is updated and whether there are quality problems.
Customer names, product codes, dates and categories may be inconsistent across systems. These issues should be resolved before dashboard calculations are finalized.
4. Define Metrics Clearly
Every important measure should have an agreed definition.
For example, does revenue mean orders placed, invoices issued, cash received or revenue recognized? Does a new customer mean a first purchase or a newly created CRM record?
Clear definitions prevent confusion and make the dashboard trustworthy.
5. Design for Action
Use summary cards for important outcomes, trends for changes over time and tables for detailed exceptions.
The user should be able to identify a problem and understand the next step. Visuals should be arranged according to importance rather than filling every available space.
6. Validate Against Source Systems
Before launch, reconcile dashboard totals with approved accounting, CRM or operational reports.
Differences should be understood and documented. Users will stop trusting a dashboard if it cannot explain why its numbers differ from the systems they already use.
7. Automate Refresh and Monitor Performance
Set an appropriate refresh schedule and monitor failures.
A daily financial dashboard may be sufficient for one business, while an order or inventory dashboard may need more frequent updates.
Refresh frequency should reflect the speed at which users can act on the information.
8. Review and Improve
Dashboards should evolve with the business. New products, sales channels, locations and systems may require updates to the data model and KPIs.
Review usage regularly and remove reports that are no longer relevant.
Examples of how reporting solutions can be structured across different business requirements are available through Versich’s Power BI case studies.
Common Small Business Dashboard Mistakes
Displaying Too Much Information
A crowded dashboard makes important signals harder to see.
Separate executive, financial, sales and operational reporting when different audiences need different levels of detail.
Using Unclear or Inconsistent KPIs
If teams define revenue, margin, customer or conversion differently, the dashboard will create disagreement instead of clarity.
KPI definitions should be approved and documented.
Relying on Manual Data Preparation
Dashboards that depend on someone copying and adjusting spreadsheets every week remain vulnerable to delay and error.
Automate repetitive preparation wherever practical, while retaining controls that detect incomplete or unusual data.
Ignoring Data Quality
Missing customer categories, duplicate accounts, incorrect dates and inconsistent product codes can produce misleading results.
Data quality should be treated as part of the BI solution, not as a separate issue that can be ignored.
Focusing on Appearance Instead of Decisions
A modern design is useful, but the dashboard must help someone decide or act.
Every visual should have a purpose. If a chart does not support a business question, it may not belong on the page.
Launching Without Ownership or Support
Dashboards require ongoing maintenance. Source systems change, user access must be managed and new reporting requirements emerge.
A clear support model prevents reports from becoming outdated or unreliable.
Versich provides Power BI support services for businesses that need help resolving refresh issues, improving report performance, modifying data models, maintaining dashboards and extending existing analytics solutions.
How Small Business Dashboards Support Growth
As a company grows, informal reporting becomes less effective. The owner can no longer monitor every transaction, customer and employee directly.
More systems are introduced, responsibilities are delegated and decisions must be made by managers across different functions.
Dashboards create a management framework for that transition. They allow leaders to define what good performance looks like and give managers the information needed to take responsibility for results.
A sales manager can own pipeline conversion. An operations manager can own delivery performance. A finance manager can own cash collection and budget control.
Business Intelligence also helps a company prepare for external reporting requirements. Lenders, investors and potential buyers may ask for consistent historical performance, customer concentration, recurring revenue, forecasts and profitability analysis.
A structured data model makes these questions easier to answer.
The dashboard itself is not a growth strategy, but it makes growth easier to manage. It reveals which products, customers, employees, locations and channels contribute the strongest results.
It also shows where growth is creating pressure on cash, capacity, inventory or service quality.
How Versich Helps Small Businesses with Power BI
Versich helps businesses turn data from finance, sales, marketing, operations and customer systems into practical Business Intelligence solutions.
This can include connecting source applications, cleaning data, designing data models, defining KPIs and building interactive dashboards for owners and management teams.
The objective is to create reporting that reflects how the business is managed.
A useful solution should reconcile with source systems, refresh reliably, protect sensitive information and allow users to move from a high-level result to the underlying detail.
Versich can support:
- Power BI strategy and dashboard requirements
- Connections to accounting, CRM, e-commerce and operational systems
- Data cleaning and transformation
- Financial and operational data models
- Executive and departmental dashboards
- Budget, forecast and variance reporting
- Sales and marketing analytics
- Inventory and customer reporting
- Power BI performance optimization
- User access, governance and ongoing support
Organizations that need additional delivery capacity can also hire our Power BI developers for Power BI development, Power Query, DAX, data modeling, integrations, report optimization and dashboard enhancements.
Conclusion
Small business dashboards bring important information together so owners and managers can understand performance without relying on disconnected systems and manual spreadsheets. They can show what happened, explain why it happened and provide early indicators of what may happen next.
The most effective dashboards begin with clear business questions, trusted data and agreed KPI definitions.
Whether the platform is Power BI, Tableau, Qlik Sense, Zoho Analytics, Oracle Analytics Cloud or Excel, the goal should be the same: make important decisions easier and faster. Send us a message for Help with dashboard development and Analytics


