Most companies do not lack data. They lack a reliable way to turn that data into something a leadership team can act on the same day it is collected. Analytics as a Service solves that gap by combining analytics tools, cloud infrastructure, and ongoing expert support into a single subscription, so organisations get dashboards and insight on demand rather than waiting on a slow internal build.
This blog walks through what the Analytics as a Service model actually includes, how the pricing structure works, what happens behind the scenes to keep data flowing, the benefits organisations see once it is running, and where it tends to deliver the most value.
What Analytics As A Service Actually Means
At its core, analytics as a service replaces the traditional path of hiring a data analyst, briefing them, and waiting weeks or months for a usable dashboard. Instead, a business gets immediate access to pre-built analytics solutions, managed infrastructure, and an outsourced team that keeps everything running and current.
Good analytics is never just about software access. It requires clear objectives, clean data, accurate models, useful visualisation, and continuous upkeep as the business changes. Rather than treating each of these as a separate project, analytics as a service folds them into one ongoing, scalable service: data integration, maintenance, KPI development, automated reporting, and a standing line of analytical support for leadership.
For companies without an internal data team, or those who simply do not want to go through a lengthy hiring cycle, this turns analytics into a predictable, manageable capability rather than a recurring internal project.
How the Subscription Model is Structured
Analytics as a service is built around a recurring fee rather than a large upfront investment. Instead of funding an in-house data team and the infrastructure behind it, a business pays for ongoing access to analytics tools, ready-made reporting, and continuous expert support. Software access, managed infrastructure, and consulting guidance all roll into one predictable monthly or annual cost.
That cost typically breaks down into three tiers that scale with how much customisation a business actually needs.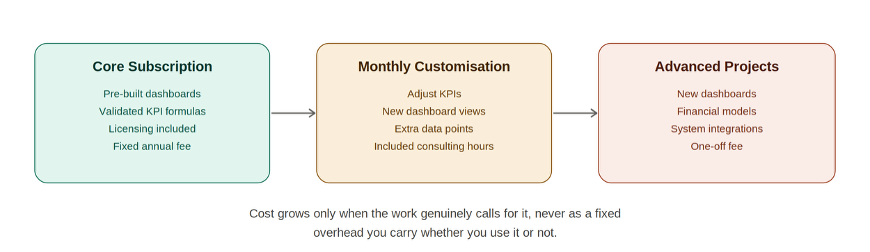
The three layers of the subscription model, from ready-made dashboards through to bespoke project work.
What Runs Behind The Dashboard
Our delivery model combines proprietary extraction software, managed cloud infrastructure, and hands-on customisation, so the client only ever sees the finished reporting layer.
Data Extraction
Data is pulled directly from the platforms a business already uses, including accounting systems, e-commerce platforms, communication tools, and project management software. The extraction software is certified for technical performance and data security, and it feeds straight into pre-built Power BI templates that already carry validated KPI formulas and reporting structures. Clients get accurate reporting without needing to design a data model themselves, and access to this layer runs through an annual subscription.
Managed cloud services
Everything extracted is stored securely in a managed SQL environment. Versich takes on the cloud infrastructure costs, the databases, the report templates, and the reliability of every data refresh, which removes the burden of overseeing servers, backups, or backend plumbing entirely. The result is a fully managed analytics environment that the client never has to think about.
Customization where it is needed
Templates give a strong starting point, but most businesses eventually want something adjusted. Light tweaks to dashboards, KPIs, or analyses typically fall within the monthly subscription hours, while larger analytical builds are scoped and billed separately. This hybrid approach lets a company start from a proven framework, scale into tailored analysis as it grows, and skip the cost of building a full in-house analytics function.
How Raw Data Becomes a Finished Dashboard
Underneath any analytics as a service offering, the same four building blocks have to work together. Data has to come from somewhere, move automatically, land somewhere structured, and finally get presented in a way people can actually use.
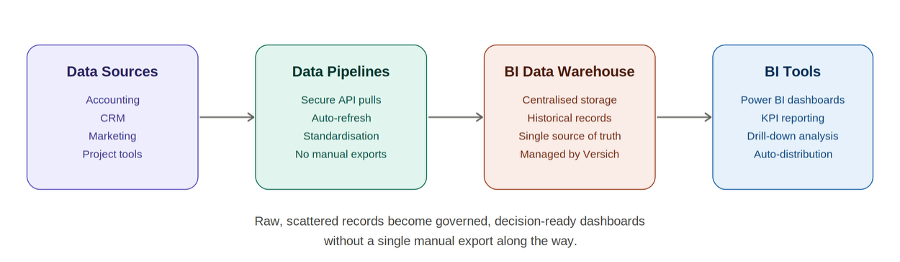
The four stages that turn scattered source data into a governed, decision ready dashboard.
Source systems, things like ERPs or accounting platforms like NetSuite, QuickBooks, Odoo, CRMs like Salesforce, Zoho marketing tools, and project management software like Asana, Jira, Clickup, hold valuable data, but they tend to operate in isolation, which makes cross-functional analysis difficult without proper integration. Automated pipelines solve the connection problem: they pull new and updated records through secure APIs, standardise the format, and refresh on a set schedule, removing the manual exports and delays that come with doing it by hand.
That data then lands in a dedicated business intelligence warehouse rather than being reported on directly from live operational systems. The warehouse centralises everything, preserves historical records, and becomes the organisation's trusted single source of truth, with Versich managing the infrastructure and guaranteeing reliable performance behind it.
BI tools such as Power BI, Tableau, or Looker Studio connect to that warehouse and turn the structured data into dashboards, KPI reports, and interactive analysis. This is the layer that supports executive reporting, department-level performance tracking, drill-down analysis, and automated report distribution, all built on pre-validated KPI logic with room for custom dashboards where needed.
Advantages Of Analytics As A Service
The advantages of analytics as a service tend to show up in ten connected ways.
1. Self-service reporting
Automated data pipelines, structured databases, and live dashboards remove the repetitive manual exports and spreadsheet work that quietly eat up a team's week. Once reporting runs itself, that time goes back into actual analysis and decision-making instead of data wrangling, and teams can answer their own questions without waiting on someone else to pull a report.
2. Improved accuracy
Automated API integrations and structured warehousing cut down on the manual entry and spreadsheet handling where errors usually creep in. Financial reporting in particular tends to get faster and more reliable once a multi-system close is built on a single, automated pipeline rather than a chain of manual exports
3. Decisions move faster
Centralising data into one source and updating it automatically means leadership sees performance metrics in real time, rather than waiting for an end-of-week or end-of-month pull. Strategic decisions that used to wait on a report can happen as soon as the data lands.
4. Revenue and margin become visible
Beyond saving time, connecting financial, operational, and marketing data in one place gives a business a real view into margins, customer behaviour, and what is actually driving cost. That visibility is often what turns a reporting project into a revenue or efficiency gain, not just a tidier spreadsheet.
5. Headcount costs come down
Hiring an in-house BI developer, data engineer, and analyst is expensive, and it carries ongoing salary and recruitment risk. A subscription model gives a business access to all three skill sets under one fee, without the fixed overhead or the hiring cycle.
6. Reporting scales without extra hiring
As a business adds new entities, products, or markets, reporting needs grow with it. Because the underlying pipelines and warehouse are already built to scale, adding a new data source or dashboard view rarely means adding headcount. The infrastructure absorbs the growth instead of the team having to.
7. Data stays consistent across departments
When finance, marketing, and operations each pull numbers from their own spreadsheets, small definitional differences quietly turn into disagreements over whose figures are right. A shared warehouse and a single set of validated KPI formulas mean every department is reporting from the same underlying numbers, so meetings spend less time reconciling data and more time acting on it.
8. Security and governance improve
Spreadsheets passed around by email or shared drive are difficult to track, version, or secure. Centralising data in a managed, access-controlled warehouse gives a business a clearer picture of who can see what, reduces the number of places sensitive figures live, and makes it far easier to maintain an audit trail than a folder of exported files ever could.
9. Forecasting becomes part of routine reporting
Once historical data is clean, structured, and centralised, it becomes far easier to layer forecasting and predictive models on top of it. Businesses that start with straightforward dashboards often find that revenue, churn, or demand forecasting is a natural next step rather than a separate project, because the groundwork is already in place.
10. The business stays focused on its core work
Building and maintaining an analytics function internally pulls attention away from the parts of the business that actually generate revenue. Outsourcing the infrastructure, the upkeep, and the reporting layer to a managed service means leadership and operational teams spend their time running the business rather than maintaining the systems that report on it.
Conclusion
Analytics as a service turns raw, scattered data into a structured, scalable capability instead of a one-off dashboard project. Automated pipelines, managed infrastructure, BI tools, and ongoing analytical support combine into a single service that gives a business faster decisions, better accuracy, and reporting that actually adapts as the business changes.
If you are ready to centralise your data, automate reporting, and build dashboards that genuinely support decision-making, we can help design an analytics as a service setup around your existing systems and growth plans. Send us a message