
How I Connected Google Analytics (GA4) to Power BI
I spent about two hours figuring out why my GA4 data was not showing up in Power BI. Turned out I was using the wrong connector version the whole time. Here is exactly what I did, what went wrong, and how to avoid the same mistakes.
Why connect GA4 to Power BI at all?
Google Analytics on its own gives you a decent amount of data but the reporting interface has limits. You cannot easily combine GA4 data with your CRM data, your ad spend, or your sales numbers in the same view. You cannot build the exact chart you want. And sharing reports with non-technical stakeholders usually means exporting a PDF that is already outdated by the time it reaches them.
When you bring GA4 into Power BI, all of that changes. You get interactive dashboards that update on schedule, the ability to combine website traffic data with any other data source you have connected, and full control over the visuals. If your team is making decisions based on website performance, this connection is genuinely worth setting up.
What you need before starting
Before you open Power BI, make sure you have these in place. Trying to connect without them is where most people waste time.
- Power BI Desktop installed (the free version works fine for this)
- A Google account that has at least Viewer access to the GA4 property you want to connect
- The GA4 property already set up and receiving data (this does not work with Universal Analytics properties)
- A stable internet connection since the connector authenticates through Google's servers
The step-by-step connection process
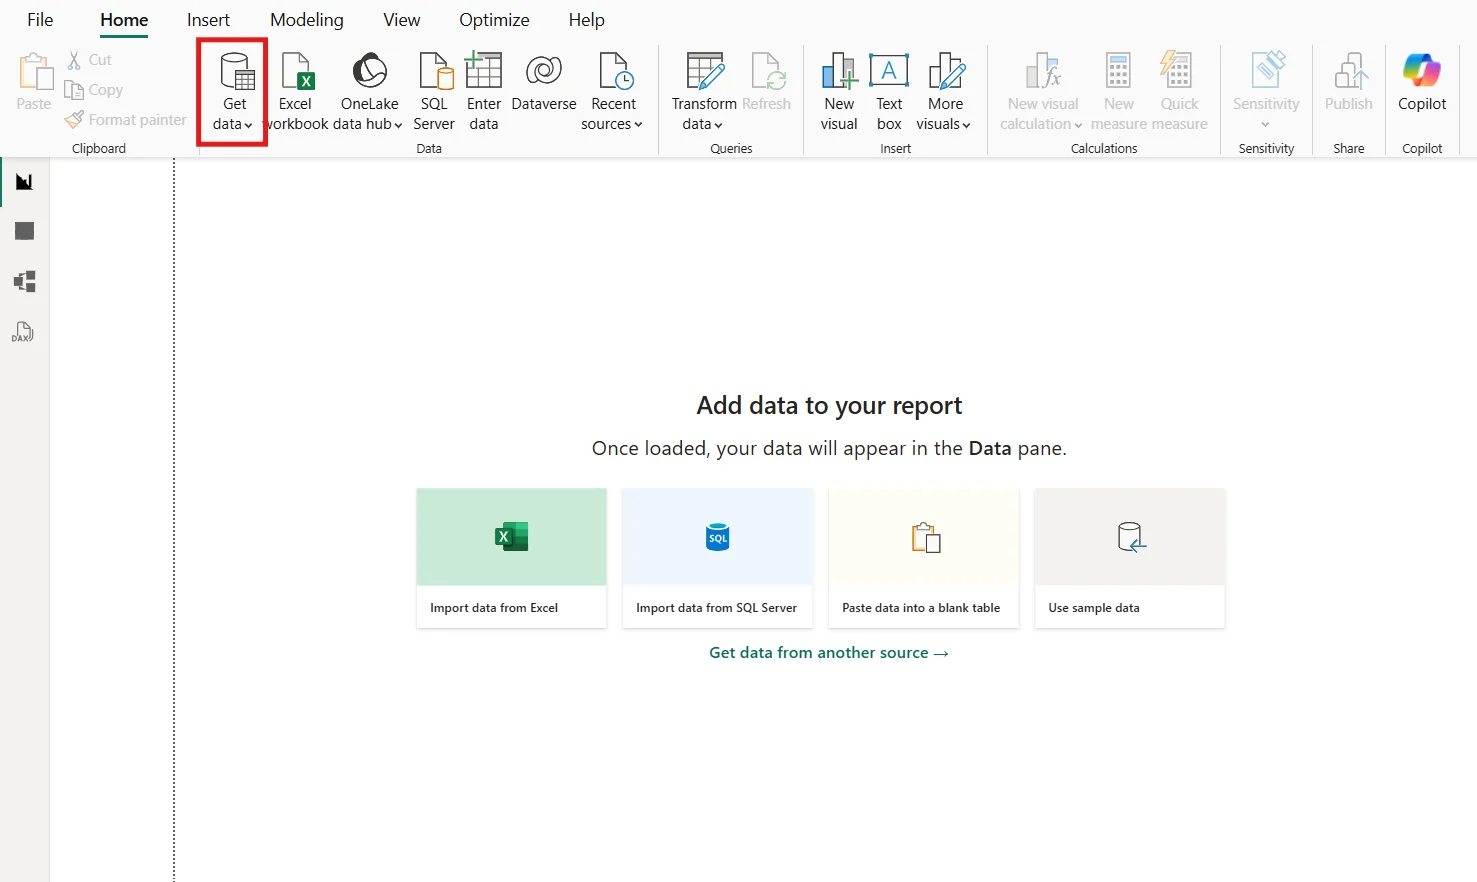
Step 1: Open Power BI Desktop and click Get Data
Open Power BI Desktop. On the Home tab in the ribbon, click Get Data. You will see a dropdown with common sources. If Google Analytics is not immediately visible, click More at the bottom to open the full connector list.
Step 2: Select Google Analytics but pick the right version
In the Get Data window, type Google Analytics in the search bar. You will see option come up: Google Analytics.
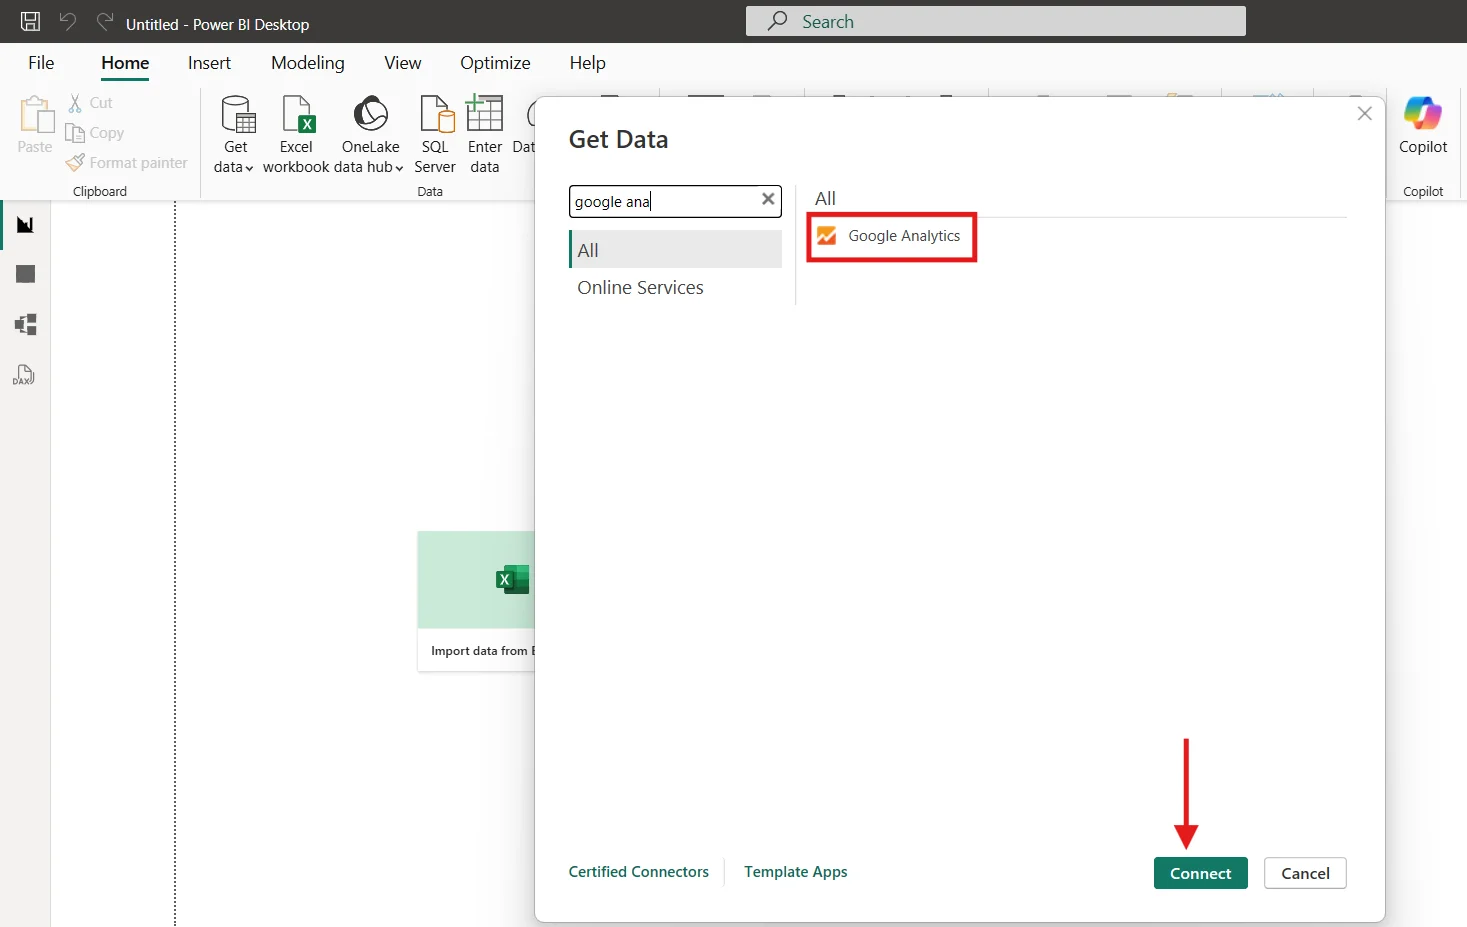
Always select Google Analytics (Beta) version 2.0. The original Google Analytics connector was built for Universal Analytics (UA) which has been sunset. Only the Beta 2.0 version supports GA4 properties. If you select the original, you will either get an error or connect to a property that no longer has data.

Step 3: Sign in with your Google account
After selecting the connector, Power BI will open a browser window asking you to sign in with Google. Use the same Google account that has access to your GA4 property. If you have multiple Google accounts, make sure you select the right one because Power BI will cache the credentials and you will need to clear them manually if you sign in with the wrong account.
Once you approve the permissions, you will be redirected back to Power BI automatically. The sign-in window should close on its own within a few seconds.
If the sign-in window does not close
Wait 10 seconds then close it manually. Power BI usually picks up the authentication token even if the window does not auto-close. If it does not, close Power BI completely, reopen it, and try again.
Step 4: Choose the correct GA4 property
After signing in you will see a navigator panel on the left side showing all the Google Analytics accounts your Google account has access to. Expand the account, then expand the property list, and select the GA4 property you want to connect.
Step 5: Select dimensions and metrics the most important step
This is where the connection actually gets configured and it is the step most tutorials rush through. Google Analytics data is structured around two concepts: dimensions describe what something is (like a page name or a country) and metrics are numbers (like how many sessions or users).
You must select at least one metric. If you only select dimensions, Power BI will pull a table with no numbers in it and you will spend a frustrating 20 minutes wondering what went wrong.
Here are the dimensions and metrics I recommend starting with depending on what you want to track:
Useful Dimensions
- Date
- Page Path
- Session Source / Medium
- Country
- Device Category
- Landing Page
- Channel Grouping
Useful Metrics
- Active Users
- Sessions
- Page Views
- Bounce Rate
- Avg Session Duration
- New Users
9 Dimension Limit
GA4 only allows a maximum of 9 dimensions in a single data request. If you try to add more, Power BI will return an error. If you need more dimensions, create separate queries and merge them in Power Query.
Start small
For your first connection, just pick Date, Session Source/Medium, and Device Category as dimensions plus Active Users, Sessions, and Page Views as metrics. Once that loads correctly, you can expand from there.
Step 6: Load or transform your data
After selecting your dimensions and metrics, you have two options at the bottom of the navigator window.
Click Load if the data looks correct in the preview and you want to bring it straight into Power BI as is. This is fine for most use cases.
Click Transform Data if you want to clean, rename columns.This opens Power Query where you can do all of that before anything hits the data model.
My recommendation is to click Transform Data at least once even if you do not plan to make changes. It lets you see exactly what is coming through and gives you a chance to rename the column headers from the GA4 API format to something more readable before your colleagues see them.
Troubleshooting common errors
These are the errors I ran into or have seen others run into when setting this up. If something goes wrong, check here first.
- Data loads but the table is completely empty : This almost always means you selected only dimensions and no metrics. Go back to Get Data, reconnect, and make sure at least one metric is selected alongside your dimensions. An empty table with column headers but no rows is the classic sign of a missing metric.
- Authentication failed or sign-in loop : Close Power BI completely. Go to File, Options and Settings, Data Source Settings and remove the Google Analytics credential. Then reopen Power BI and try connecting again from scratch. This clears the cached token that is causing the loop.
- The request exceeded the maximum number of dimensions : You have selected more than 9 dimensions in a single request. Remove some dimensions until you are at 9 or below. If you genuinely need more, create a second query with a different dimension set and merge the two tables in Power Query using a common key like Date.
- Numbers look different from what GA4 shows natively : GA4 uses sampling for large date ranges and the API returns slightly different figures than the GA4 interface in some cases. This is a known GA4 API behaviour. For most reporting purposes the numbers are close enough.
- Property not showing in the navigator : The Google account you signed in with does not have access to that GA4 property. Check in Google Analytics directly that the account has at least Viewer role on the property. If someone else set up GA4, ask them to add your account as a user before trying again.
Common mistakes to avoid
- Using the non-Beta connector. Always use Google Analytics (Beta) version 2.0. The original connector does not support GA4 properties.
- Selecting only dimensions. You must include at least one metric or the table will be empty.
- Exceeding 9 dimensions in one query. GA4 will reject the request. Stay at 9 or below per query.
- Not adding a date dimension. Without Date in your dimensions, all your data aggregates into a single row with no time breakdown. Always include Date unless you specifically want an all-time total.
- Loading too much data at once. Selecting very large date ranges with many dimensions and metrics makes the load slow and can time out.