Running a small business means making quick decisions, often with limited time and scattered data. When key metrics are spread across various spreadsheets, accounting tools, CRMs, and marketing platforms, it's easy to overlook critical issues affecting cash flow and growth. Small business dashboards can address this by consolidating fragmented data into a single, real-time view of performance. The ideal dashboards for small business management are effective, customizable, and facilitate collaboration, empowering teams to make informed decisions effortlessly.
Small business dashboards should prominently feature real-time KPIs, intuitive visualizations, and actionable insights to enhance decision-making. At Versich, we have provided dashboard development services to over 1,000 small and mid-sized businesses across various sectors, including finance, sales, marketing, and operations. Our team has collaborated with organizations ranging from startups to large enterprises with thousands of employees, helping them transition from manual reporting to automated dashboards that save hours weekly. Choosing the right small business dashboard offers a competitive edge by delivering real-time insights and streamlining decision-making.
In this guide, we’ll explore what a small business dashboard is, why it is vital, how much it costs, and which metrics you should prioritize. We’ll also share real-world examples of dashboards, including templates featuring time-saving drag-and-drop capabilities, along with the best software tools for creating them. Implementing a small business dashboard today is essential to gain immediate insights and maintain a competitive advantage.
What Are Small Business Dashboards?
Small business dashboards are visual reporting tools that centralize your most vital data into one clear view. They replace scattered spreadsheets and manual reports with real-time charts that show your business's actual performance.
Instead of searching through multiple apps, a dashboard gathers data from sales, marketing, finance, and operations into one location. This simplifies spotting trends, anticipating problems early, and addressing small issues before they escalate into costly ones.
For small businesses with limited time and strict budgets, dashboards are not about “advanced analytics.” They primarily focus on saving time each week, maintaining control of cash flow, and making faster, more confident decisions based on current data.
Cost of Small Business Dashboard Development
Cost is often the first concern for small businesses, and rightly so. With tight budgets, any investment in analytics must be practical and justifiable.
For most of our small business dashboard projects, costs are predictable and transparent. Our dashboards typically start from $1,000 for development, with ongoing software licensing ranging from $14 to $75 per month, depending on the platform and access requirements.
The total cost usually comprises two main components.
- Software and Infrastructure: This includes the dashboard tool (like Power BI or Tableau) and sometimes data connectors that automatically pull in data from platforms like Facebook Ads or HubSpot. Many small businesses can avoid building a data warehouse initially, keeping costs down.
- Development and Setup: This often constitutes the larger portion of the cost, covering data modeling, coding KPIs, and designing the dashboard. Investing in the right tools can lower costs, as quicker development translates to fewer consulting hours and faster return on investment.
The key is to start small. Focus on the metrics that are most relevant today, keep the setup straightforward, and scale the dashboard as your business grows.
Small Business KPI Dashboards: Essential Metrics and Real-World Examples
For small businesses, starting with a ready-made dashboard is usually more practical than building everything from scratch. Existing solutions reduce workload while allowing for quicker delivery and lower total costs. We offer dashboard templates specifically designed for small businesses, making customization simple and time-efficient while leveraging drag-and-drop features.
Our examples of pre-built small business dashboards are detailed below. These dashboards are designed and tested, allowing for quick connections to your data sources. This approach maintains affordability while continuing to deliver valuable insights. When getting started, prioritize tracking 5 to 7 critical metrics instead of attempting to monitor 50, as this avoids dashboard paralysis and ensures focus on what truly matters.
An effective dashboard is one that team members check daily, rather than a comprehensive one that remains unused.
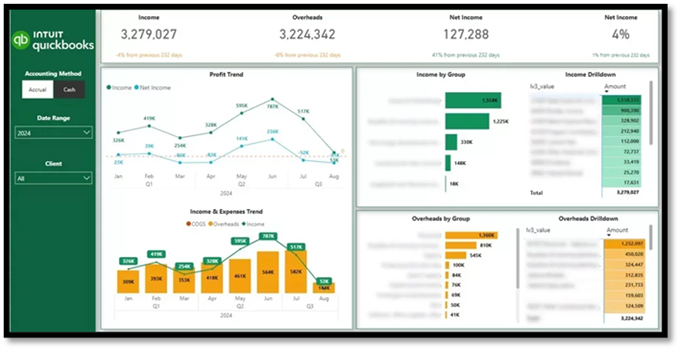
Small Business Financial Dashboard
Data Sources: QuickBooks Online, Xero, Zoho Books
Essential Financial Metrics: Income, overheads, net income trends, cash vs accrual performance, profit margins by account or service, expense breakdown by category, outstanding and overdue balances.
A financial dashboard provides small business owners with a clear view of financial inflows and outflows, alongside the business's sustainability. It replaces static profit-and-loss reports with dynamic trends and drill-downs that one can act upon.
Our financial dashboard template displays monthly trends for Income, Overheads, and Net Income, providing business owners with an instant overview of financial performance over time. Income and overheads are dissected by account and individual transactions, making it easy to understand the factors influencing each figure. Users can toggle between accrual and cash accounting, filter by client (for businesses using multiple QuickBooks accounts), and analyze results by category.
For our clients, this dashboard replaced manual month-end reports, enhanced cash flow visibility, and facilitated early identification of cost increases or margin issues before they affected the business.
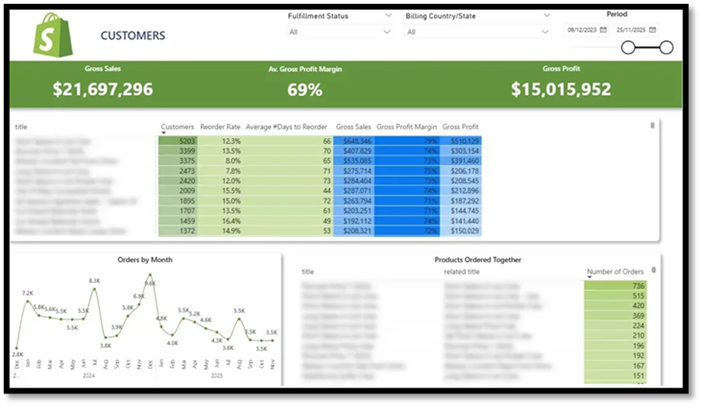
Small Business Ecommerce Dashboard
Data Sources: Shopify, Magento
Essential Ecommerce Metrics: Customer LTV, number of customers per product, reorder rate, average days between purchases, product-level revenue and profitability, monthly order volume by product, and frequently purchased product pairs.
An e-commerce dashboard helps online retailers understand which products generate repeat revenue and identify areas for merchandising improvement. It provides more than just top-line sales figures; it uncovers buying habits and product relationships.
We developed this Shopify ecommerce template for a retailer with an extensive product catalog struggling to identify which products to market, bundle, or phase out. While revenue remained stable, average order values and repeat purchases lagged behind benchmarks.
The dashboard summarizes product-level performance, showcasing customer purchase frequency, reorder behavior, and average time between purchases. Selecting a product allows dynamic filtering of monthly order trends, making it easy to identify growth patterns and seasonal changes. The dashboard also highlights frequently purchased items together, fostering informed upselling, bundling, and merchandising decisions. As a result, our client automated upsell suggestions at checkout and initiated reorder reminders based on average repurchase timelines, leading to increased revenue per customer and better long-term retention.
Small Business Project Management Dashboard
Data Sources: ClickUp, Trello
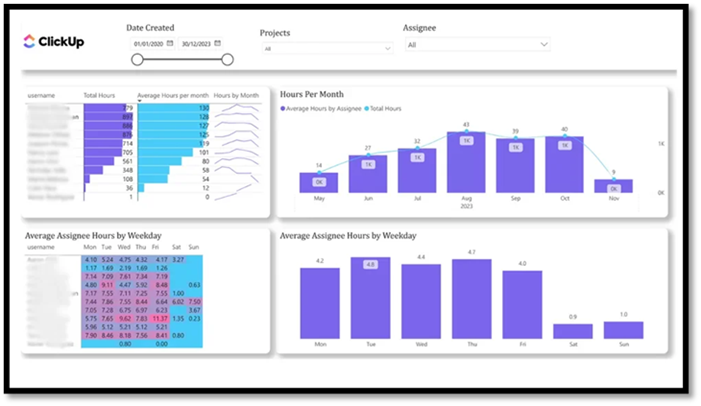
Essential Project Management Metrics: Total hours worked by project and team member, average hours daily and monthly, resource utilization rates, workload distribution, and early indications of over- or under-utilization.
A project management dashboard ensures service-based businesses remain profitable by providing visibility into time and resource utilization. It directly connects project delivery with workload, capacity, and team performance.
Our team created a free project management template that assesses the effectiveness of resource allocation based on logged hours. It represents total hours and averages per assignee, with views segmented by day and month, across all projects or a specific workspace.
By visualizing workload trends, managers can quickly recognize when team members are overwhelmed or underutilized. For instance, if an employee's hours decrease following a busy period, it's easier to investigate the situation and reassign tasks before resources go to waste.
For our client, this dashboard improved workload balance, minimized burnout, and ensured projects were effectively staffed without guesswork.
Small Business Marketing Dashboard
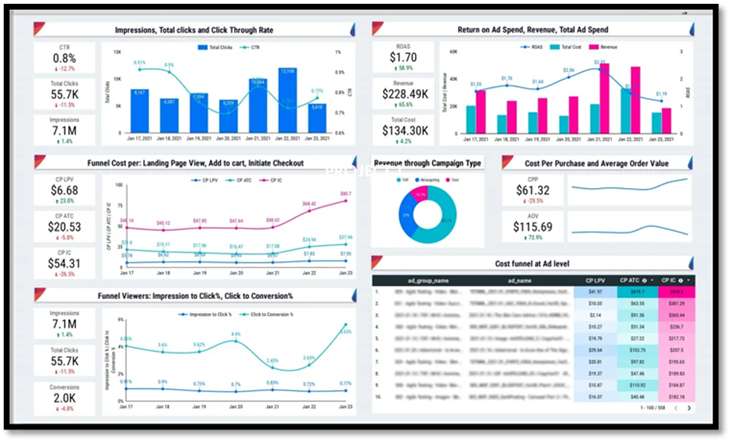
Data Sources: Facebook Ads, Google Ads
Essential Marketing Metrics: Ad spend, revenue, ROAS, impressions, clicks, CTR, conversion rates at various funnel stages, cost per action, average order value (AOV).
A marketing dashboard helps small businesses evaluate the return on their advertising investments and pinpoint where funnel performance declines.
Our marketing analysts designed a dashboard that illustrates how effectively Facebook Ads engage users from impression through to purchase. It tracks ad spend alongside revenue, ROAS, impressions, clicks, and conversion rates at each step of the funnel.
By visualizing costs per landing page view, add-to-cart, checkout, and purchase, businesses rapidly identify where budgets may be wasted and where optimizations can yield the most significant impact. This dashboard helped our clients make quicker budget decisions and enhanced their ROAS, enabling a more confident scaling of profitable campaigns.
Small Business B2B Sales Dashboard
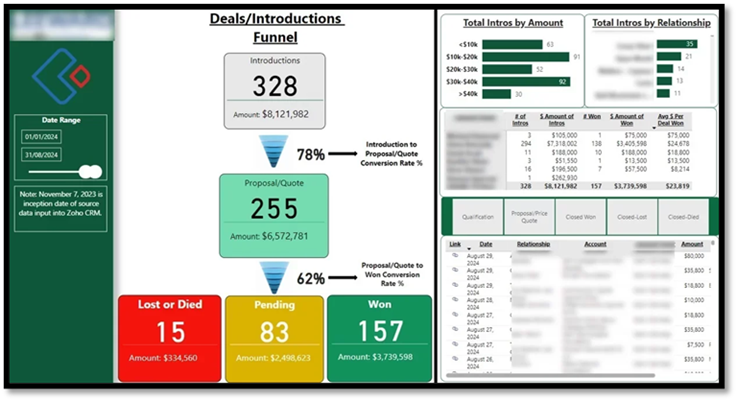
Data Sources: HubSpot, Pipedrive, Zoho CRM
Essential Sales Metrics: Pipeline value and stage distribution, conversion rates between stages, average deal size, sales cycle length, revenue vs target, performance by salesperson.
A sales dashboard provides clarity on revenue generation and where deals may stall. It consolidates pipeline activity, deal quality, and sales performance into one view for improved forecasting and focused efforts.
We assisted a financial services company in visualizing their Zoho CRM data through Power BI, utilizing an automated connector for near real-time updates. Our dashboard emphasized deal sources, funnel conversion rates, average deal size, and account manager performance. This enabled the client to uncover bottlenecks in their B2B sales process, prioritize high-quality leads, and enhance forecasting through live CRM data instead of static reports.
Small Business SEO Dashboard
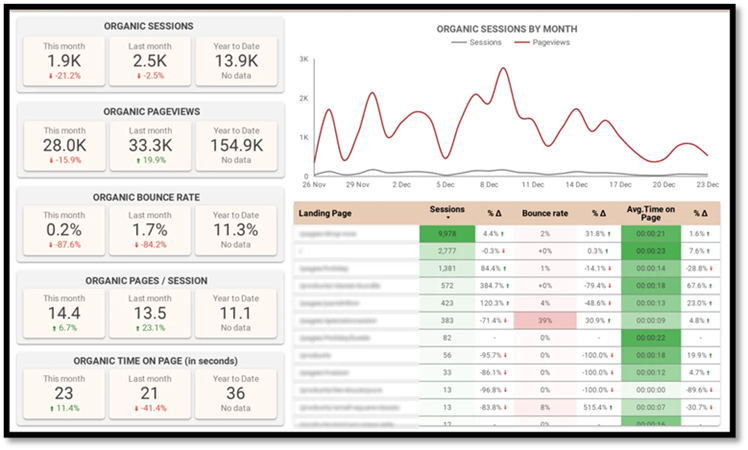
Data Source: Google Analytics
Essential SEO Metrics: Organic sessions and pageviews, bounce rate, time on page, trends in organic traffic, top landing pages by performance, and engagement changes over time.
An SEO dashboard offers insights into organic traffic engagement once users arrive at the site. It emphasizes content performance and engagement rather than just rankings, allowing teams to focus on high-impact pages.
This SEO Looker Studio dashboard displays organic sessions, pageviews, bounce rate, and time on page for current, previous, and last year. This setup enables quick spotting of performance changes.
It includes page-level analyses for sessions, bounce rate, and average time on page, determining which content brings in traffic but fails to engage effectively. Daily trend charts help clients identify growth patterns and sudden drops, allowing them to swiftly rectify SEO issues and prioritize content enhancements that improve organic conversions.
Small Business Social Media Dashboard
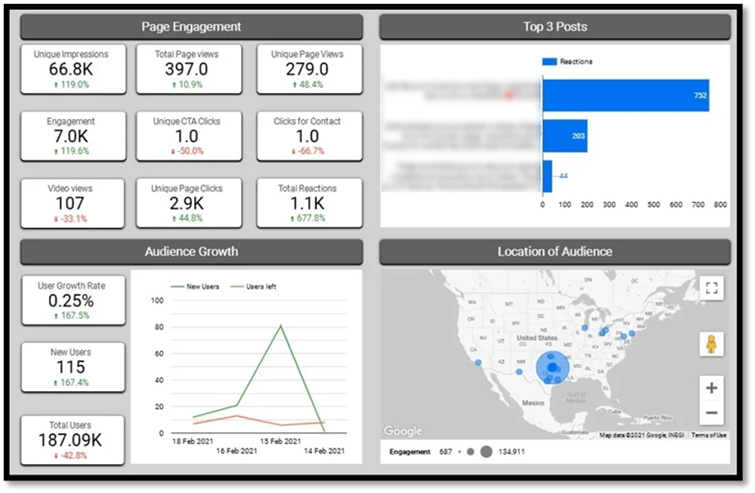
Data Sources: Facebook, Instagram, LinkedIn, YouTube
Essential Social Media Metrics: Total impressions, page clicks, reactions, engagements, top-performing posts, follower growth, unfollows, and audience demographics.
A social media dashboard helps marketing teams gauge which content resonates with their audience and how social channels contribute to long-term growth. It focuses on meaningful engagement rather than superficial metrics.
Our BI experts designed a Looker Studio social media dashboard that tracks impressions, clicks, reactions, and total engagement, highlighted by the top three posts based on reactions. This focus simplifies identification of the content types and topics that generate the strongest audience interactions.
Follower growth trends are monitored over time via new follower counts and unfollows, allowing teams to assess campaign impacts and posting strategies effectively. A geographic breakdown provides insights into audience engagement levels by state, enabling targeted content planning and optimization of regional campaigns.
For our clients, this dashboard streamlines reporting, enhances content decisions, and establishes a clear connection between posting strategies, engagement patterns, and audience growth.
Small Business Google Ads Dashboard
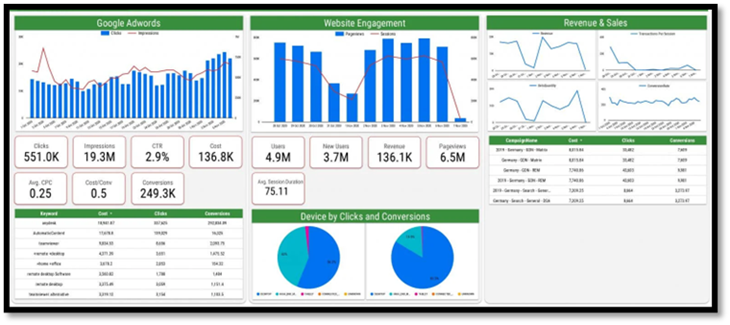
Data Sources: Google Ads, Google Analytics
Essential Google Ads Metrics: Clicks, impressions, ad spend, conversions, cost per conversion, keyword performance, sessions, pageviews, revenue, conversion rate.
A Google Ads dashboard allows businesses to understand how paid search efforts translate into website engagement and sales. By merging ad performance with website behavior, it offers a comprehensive view of campaign effectiveness.
We created this Google Ads dashboard for a SaaS business using Google Ads to boost product sign-ups and sales, while tracking on-site behavior through Google Analytics. It shows how Google Ads expenditures correlate with traffic, conversions, and revenue, integrating ad performance with website behavior data.
By correlating keywords, campaigns, devices, and revenue into one perspective, it helps teams identify which ads yield real business outcomes and which waste budgets. This dashboard has facilitated quicker optimization actions, more transparent ROI tracking, and improved budget decision-making without the hassle of switching between tools.
Small Business Dashboard Software
Power BI
- Interactive dashboards with drill-down and filtering capabilities.
- Native integration with Excel, Microsoft 365, Dynamics, and Azure.
- Strong emphasis on financial and operational KPIs.
- Automated data refresh and scheduled updates.
- Secure sharing with role-based access.
Pricing: Power BI Pro: ~$14 per user/month.
Why It Works for Small Businesses: Power BI combines efficient automation with flexible modeling and cost-effective pricing, perfectly suiting small businesses aiming for accurate financial and operational reporting without the need to rebuild dashboards as they scale.
Looker Studio
- Completely free with unlimited dashboards and users.
- Native integrations with Google Analytics, Ads, Search Console, Sheets, and BigQuery.
- An expanding library of third-party connectors.
- Real-time collaboration similar to Google Docs.
- Embeddable dashboards for websites or client portals.
Pricing: Free (connectors may incur minor monthly fees).
Why It Works for Small Businesses: Looker Studio is ideal for tight budgets with data managed within Google tools, delivering shareable dashboards at no licensing cost, making it an ideal choice for marketing and SEO reporting.
Tableau
- Highly customizable, presentation-ready visualizations.
- Strong support for exploratory data analysis.
- Compatible with a wide range of data sources.
- Flexible dashboard designs suited for storytelling.
Pricing: Tableau Creator: ~$70 per user/month; Tableau Viewer: ~$15 per user/month.
Why It Works for Small Businesses: Tableau is an excellent option for businesses that prioritize visual quality and in-depth analysis over simple operational reporting, making it suitable for those with dedicated analytics requirements.
Benefits of Using a Dashboard
Small businesses can't afford delays in insights, especially when margins are slim; missing trends for even a week could lead to cash flow complications, loss of customers, or stock issues that quickly escalate. Dashboards surface potential problems early, ensuring there's time to act while also eliminating hours of manual reporting by automatically consolidating data from various tools.
Rather than spending precious time gathering figures just to gauge performance, business owners gain immediate visibility and can concentrate on sales, operations, and growth.
Dashboards are particularly valuable for early-stage SaaS startups where tracking cash flow, customer acquisition cost, and churn rate can mean the difference between thriving and stagnating. A financial dashboard helps identify trends, manage costs, and make informed resource allocation decisions.
On the marketing front, dedicated marketing dashboards facilitate tracking performance across multiple channels, enabling strategy comparison and optimized campaigns for enhanced results. Whether you're utilizing email marketing, paid ads, or organic outreach, dashboards provide crucial insights for adjusting tactics and maximizing ROI.
Ultimately, dashboards minimize manual tasks, save time, and allow you to focus on revenue-generating actions. With all this data at hand, you can monitor performance, discover opportunities, and make educated decisions, driving your business forward.
Best Practices for Dashboard Creation
Creating an efficient dashboard begins with simplicity and focus. Small business owners should highlight key metrics affecting business performance directly, rather than trying to track every possible data point. Utilizing pre-built templates can save time and ensure your dashboard remains user-friendly and customizable.
Integrating your dashboard with essential tools like Google Analytics and your CRM system offers a comprehensive, real-time overview of your business. Avoid cluttering your dashboard with vanity metrics; instead, concentrate on critical data that informs decisions, such as revenue, conversion rates, and customer acquisition costs.
A well-crafted dashboard delivers actionable insights at a glance, enabling you and your team to make ethical choices quickly. By adhering to these best practices-prioritizing simplicity, focusing on what matters, and utilizing real-time analytics-you'll create a dashboard that promotes growth and enhances overall business performance.
Common Mistakes to Avoid
One frequent mistake small businesses make is attempting to track too many metrics simultaneously. Overloaded dashboards can quickly become confusing and rarely spur action. It's significantly more efficient to concentrate on a limited number of KPIs that directly impact revenue, cash flow, and growth.
Another common issue arises when reliance is placed on manual data updates or poorly connected platforms. Dashboards that lack full automation rapidly become outdated, driving teams back to spreadsheet-based methods. This undermines the very purpose of having a dashboard.
Small businesses should avoid vanity metrics that, while visually appealing, do not support strategic decisions. Metrics like follower counts or pageviews are meaningless without a connection to conversions, retention, or revenue.
Finally, using generic dashboards without customization can limit their effectiveness. Dashboards should accurately reflect your business operations, rather than merely showcasing what is easy to report. When based on the right KPIs and automated data sources, dashboards yield real-time insights that enable smarter and quicker decisions.
Ready to Build Your Small Business Dashboard?
Small business dashboards aren't just about accumulating more data. They focus on having the right data available in the right place and at the right time. When your crucial metrics are clear and current, decision-making becomes faster, simpler, and significantly less stressful.
The most efficient dashboards start with a few critical metrics that influence revenue, cash flow, and delivery today, then expand as your business flourishes. With proper setup, dashboards quickly pay for themselves by saving time, mitigating risk, and improving performance. If you're ready to move beyond spreadsheets and manual reports, Versich can assist you. We design and create custom small business dashboards tailored to your objectives. Reach out to discuss your needs or start with a proven template for immediate value!