An OKR dashboard transforms objectives and key results into a clear view of progress, assisting teams in staying focused and enabling leaders to make swifter decisions. As a leading Power BI consultancy, Versich has delivered over 1,000 custom OKR dashboards spanning multiple business functions, including finance, operations, sales, and marketing. Our team has developed performance dashboards for a range of organizations, from dynamic startups to major enterprises. Powered by cutting-edge BI technologies, these solutions help teams move beyond static reporting, enabling data-driven continuous improvement. In this guide, we’ll explore what an OKR dashboard is, the differences between OKR and KPI dashboards, and the numerous benefits of adopting one across your organization. You’ll also find real-world examples of OKR dashboards by department and practical tips on creating an effective OKR dashboard while avoiding common pitfalls.
What Are OKR Dashboards?
An OKR dashboard is a centralized tool displaying how objectives and key results progress across teams or an entire organization. Combining clear goals with measurable outcomes, OKRs (objectives and key results) provide a structured goal-setting framework. Instead of navigating through scattered documents, an OKR dashboard integrates objectives, metrics, and status updates into one accessible view for quick insights.
At its essence, an OKR dashboard enhances visibility and accountability. Features like progress bars, charts, and status indicators clarify what is on track, what is at risk, and where immediate attention is needed. As teams update their OKRs, the dashboard reflects real-time changes, ensuring priorities are consistently aligned.
A successful OKR dashboard connects daily activities with company goals, allowing individuals to see how their contributions influence key results. Leaders can swiftly evaluate progress and make data-informed decisions. By fostering transparency and accountability, OKR dashboards keep teams focused on priorities.
OKR vs. Key Performance Indicators (KPI) Dashboards
While OKRs and KPIs are interconnected, they serve different purposes, which is evident in their respective dashboards.
OKRs (Objectives and Key Results) are designed to sharpen focus, align teams, and drive change. An OKR dashboard illustrates desired outcomes and measures progress over time, helping teams establish priorities and recalibrate their efforts.
Conversely, KPIs (Key Performance Indicators) are metrics that gauge the ongoing health and performance of a business or process. A KPI dashboard tracks real-time indicators, such as revenue, conversion rates, and customer retention, ensuring operations remain effective.
In summary, OKR dashboards are strategic and directional, whereas KPI dashboards are operational and diagnostic. Strategic OKRs align company-wide objectives with tactical initiatives, ensuring that high-level goals cascade throughout the organization. While OKRs often incorporate KPIs as supporting signals, they primarily aim to drive performance forward as opposed to merely monitoring it.
How OKR Dashboards Are Used In Practice
OKR dashboards help organizations progress toward their strategic objectives by transforming plans into visible actions. Here are five steps illustrating how businesses leverage OKR dashboards:
1. Start with a clear strategic objective
Leadership identifies a select few outcomes critical to the business, which express what the organization aims to achieve, not the approach.
Example: “Increase annual revenue by 10%”
2. Break the objective into team-level contributions
Each team determines how their work impacts the objective, encouraging shared strategy rather than siloed efforts.
Example: Marketing focuses on lead quality, Sales on conversion rates, and Customer Success on renewals.
3. Define measurable key results reflecting real change
Key results specify the improvements necessary to realize the objective, combining outcomes with their drivers.
Example: “Increase qualified demos by 20%” or “Reduce churn from 8% to 6%.”
4. Track execution and outcomes in one place
The OKR dashboard displays both activity and result metrics, enabling teams to assess whether their efforts translate into desired impacts.
Example: Calls made and demos booked (execution) alongside deals closed and revenue generated (outcomes).
5. Use the dashboard to review, learn, and adjust
Regular reviews leverage the dashboard to pinpoint successes and challenges. Teams can then realign priorities, resources, or tactics before minor issues escalate.
Example: If high activity doesn’t yield results, leaders focus on training, messaging, or process improvements instead of simply increasing volume.
By making strategy quantifiable and progress visible, OKR dashboards transform strategic goals into continual, data-driven decision-making rather than static plans.
Power BI OKR Dashboards Examples And Templates
OKR dashboards vary considerably depending on the department and the outcomes they support. While the framework of OKRs remains consistent, metrics, visualizations, and focus areas differ across functions. Building customized OKR dashboards is essential, as goal-setting diverges across organizations. Teams define objectives, measure success, and review progress in ways that align with their strategy, structure, and culture. Generic dashboards rarely capture the essence of what truly matters, while unique OKR dashboards guarantee alignment of goals, metrics, and reporting with a company's operations and decision-making strategies.
Project Execution OKR Dashboard
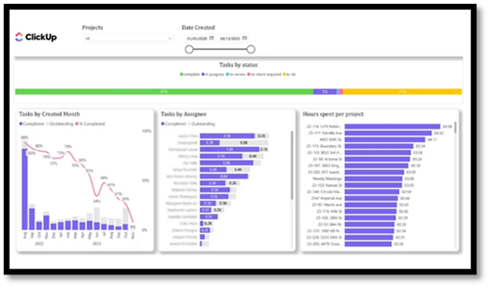
A Project Execution OKR dashboard showcases task progress, team performance, and resource allocation visualizations.
Versich’s data visualization specialists developed a Project Execution OKR dashboard that links project objectives with daily tasks. It delivers clarity on task creation, completion, and effort distribution, aiding teams in staying aligned with project goals while enabling managers to monitor progress and performance in real time.
Objectives focus on successful project execution, such as timely delivery, consistent productivity, and balanced workloads. Linking these objectives to task activity helps teams grasp how operational tasks contribute to broader OKRs. Key results include monthly completed and outstanding tasks, paired with a trend line representing the task completion rate over time. This insight enables project managers to evaluate whether progress is speeding up or slowing down, allowing for early risk identification.
By assessing task completion and contributions from team members, managers can evaluate overall progress and identify individuals who may be lagging or neglecting activity tracking. Monitoring the key results of each team member ensures visibility and measurability of all efforts aligned with strategic objectives.
Employee Task Status OKR Dashboard
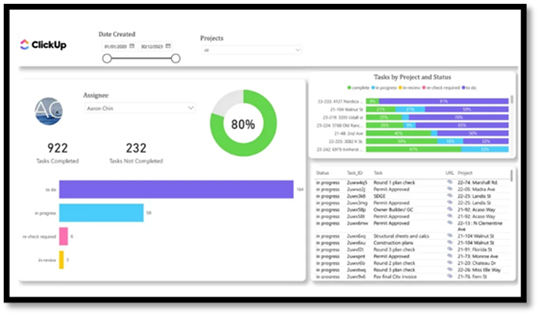
An Employee Task Status OKR dashboard illustrates individual task statuses, blocked work, and project-level visibility.
Our analysts have created an Employee Task Status OKR dashboard that assists project managers and team leads in analyzing progress at the contributor level. By filtering for specific employees, managers quickly observe task distribution across various statuses, simplifying the identification of blockers and workload issues before they impede delivery.
Objectives pertain to maintaining steady individual progress, minimizing blocked work, and ensuring continuous contributions across projects. By aligning personal task execution with team and project goals, this dashboard enhances accountability and transparency around individual OKRs. Key results are tracked through task status breakdowns, focusing on active, completed, and blocked tasks per employee. It allows managers to proactively identify obstacles preventing progress and take timely action.
Through analysis of task statuses, managers gain insight into potential slowdowns and their causes, making it easier to recognize recurring blockers, uneven workloads, or lack of activity. This fosters timely interventions and constructive, data-driven discussions, thereby enhancing execution consistency and ensuring individual contributions align with project and team OKRs over time.
Finance OKR Dashboard
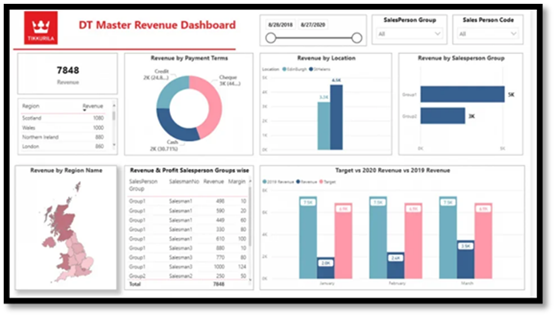
A Finance OKR dashboard visualizes revenue performance, profitability, and progress towards financial targets.
Versich’s Power BI consultants have developed a finance OKR dashboard that consolidates sales activity, revenue, and margin data into a unified view for finance and commercial leaders to evaluate progress towards financial goals. By merging sales and financial metrics, this dashboard clarifies how sales performance impacts overall financial results.
The dashboard displays key objectives like reaching revenue targets, sustaining healthy profit margins, and improving financial predictability. By aligning sales metrics with financial outcomes, it enhances more informed planning and performance management. Key results are illustrated through revenue comparisons against targets, margin performance, and revenue breakdowns across regions and salespersons. These views provide signals of financial risks or opportunities well ahead of target misses.
By highlighting revenue and margin discrepancies early, the dashboard enables finance teams to collaborate effectively with sales, adjust forecasts, and refine financial strategies. This approach supports improved accuracy in financial OKRs and bolsters predictable organizational performance during operational reviews and forecasting sessions.
Accounting OKR Dashboard
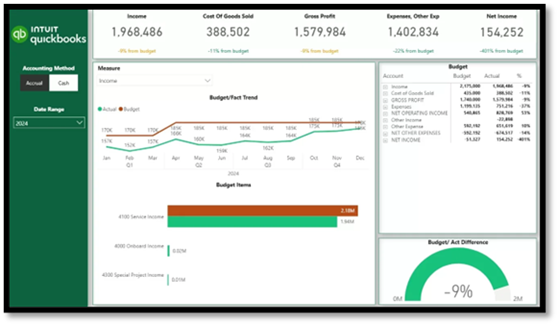
An Accounting OKR dashboard showcases budget versus actual performances, forecasts, and financial planning toward targets.
Our BI specialists developed an accounting OKR dashboard that aids finance teams in monitoring whether financial objectives are met, as well as how the organization plans to achieve these goals over time. This dashboard juxtaposes actual sales and expenses against budgeted targets and forecasts, making financial OKRs actionable and measurable throughout the timeframe.
The dashboard visualizes essential objectives such as meeting revenue and cost targets while ensuring financial predictability. By decomposing annual or quarterly targets into monthly objectives and financial categories, the dashboard aligns long-term plans with short-term execution. Key results are represented through graphs detailing actual versus budget performance by month and general ledger categories, providing insight into the company’s progression toward its financial objectives.
By illustrating both performance and planned pathways to targets, the dashboard empowers finance teams to make timely course corrections, refine forecasts, and robustly align expenditure and revenue activities with financial OKRs-transforming budgeting into an active tool rather than a passive plan.
OKR Leadership Dashboard
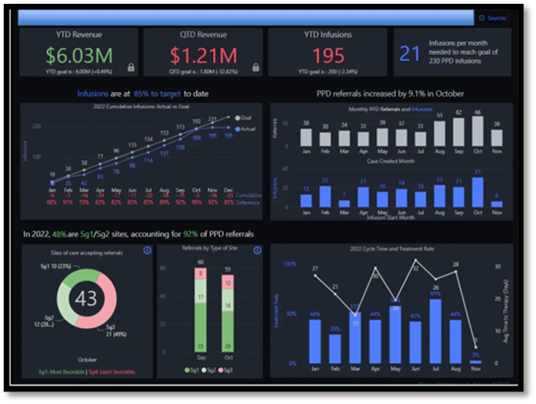
An OKR Leadership dashboard displays strategic performance, trends, and progress towards upper-level objectives.
Versich has tailored a custom OKR Leadership dashboard for a client in the pharmaceutical sector, enabling them to track new drug sales performance after its launch. The client used this dashboard for weekly performance reviews to monitor metrics and implement corrective actions.
Key objectives measured through this dashboard include successfully introducing the new drug to the market and achieving sales benchmarks. Key results track year-to-date and quarter-to-date revenue, total infusions, and performance against established targets. Trend analysis of infusions and referrals offers insights into momentum, patterns, and potential outliers, aiding leaders in comprehending whether performance is advancing or diverging from expectations.
By merging KPI summaries, trend analysis, comparative views, and target tracking, this dashboard equips executives with the tools to swiftly assess organizational health and pinpoint areas that need attention. This visibility fosters proactive decision-making, ensuring that leadership OKRs remain quantifiable, actionable, and aligned across the business.
Sales OKR Dashboard
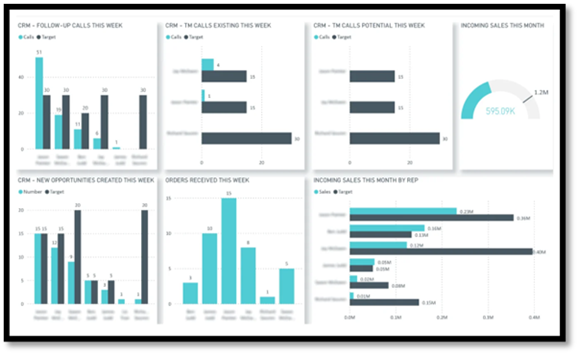
A Sales OKR dashboard highlights call performance, opportunity creation, and progress toward targets.
Versich’s data visualization specialists constructed a Sales Activity OKR dashboard that enables sales leaders and managers to monitor the effectiveness of individual representatives and the broader sales team against their activity and revenue goals. By comparing performance to explicit targets, this tool simplifies early identification of gaps and provides essential support for reps needing attention.
The primary objectives captured on this dashboard involve maintaining a predictable level of sales activity and consistently achieving revenue targets. By aligning individual performance with organizational goals, this dashboard ensures daily sales actions directly contribute to broader sales OKRs. Key results assess the tally of calls made compared to targets, opportunities created by each sales rep, and success rates for won opportunities. An aggregated performance overview across the entire sales team allows leaders to determine if overall performance aligns with expectations.
By dissecting performance insights at both the individual and organizational levels, this dashboard supports focused coaching, equitable performance assessment, and data-informed adjustments that enhance sales execution and facilitate the achievement of OKRs. Team leaders leverage the dashboard to maintain data integrity, ensure accuracy in manual inputs, and promptly support reps requiring guidance.
Benefits Of Using OKR Dashboards
OKR dashboards transform goal-setting into a dynamic, visible framework. Rather than letting goals languish in documents or sporadic updates, dashboards facilitate easy progress tracking and prompt actions:
- Clear focus on what matters most - OKR dashboards keep objectives and key results visible at all times, helping teams prioritize work that directly supports company goals while minimizing distractions.
- Real-time visibility into progress - As OKRs are updated, dashboards immediately reflect progress, enabling teams to detect delays or risks early and adapt before issues escalate.
- Stronger alignment across teams - By presenting company, team, and individual OKRs collectively, dashboards elucidate how each employee's work supports shared goals.
- Increased transparency and accountability - Visibility of progress, ownership, and outcomes enhances accountability and reduces dependency on constant status updates.
- Easier collaboration and improvement - OKR dashboards function as a common reference point for discussions, enabling teams to review results, share insights, and collaboratively refine goals.
How To Create an OKR Dashboard
Developing an effective OKR dashboard revolves more around clarity than aesthetics. A successful dashboard showcases objectives, tracks progress through measurable outcomes and promotes regular review and decision-making. Follow these steps to build one:
- Define clear objectives
- Define measurable key results
- Choose the right metrics
- Connect your data sources
Utilizing pre-built data connectors simplifies this process, allowing teams to synchronize data in real time and focus on reviewing outcomes instead of maintaining dashboards. While it is feasible to create basic OKR dashboards using tools like Google Sheets, this approach has limitations, particularly for larger teams and long-term applications. Google Sheets can lack automation, advanced customization, and seamless collaboration. For more complex needs, dedicated OKR management tools are recommended.
- Design for clarity and focus
- Share and review regularly
Common Mistakes to Avoid When Creating An OKR Dashboard
- Treating KPIs as objectives - Metrics presented without a clear connection to objectives lack context. An OKR dashboard must always begin with why a metric matters, not just what is quantified.
- Tracking too many metrics - Overloading the dashboard with information obscures priorities. Each objective should contain only a select few key results that directly influence decisions and actions.
- Focusing on activity instead of outcomes - While activity metrics like calls made or tasks completed support analysis, they shouldn’t replace outcome-focused key results that indicate genuine impact.
- Updating OKRs irregularly - Dashboards diminish in value if they’re not consistently reviewed and updated. OKRs thrive on regular monitoring and should be part of a weekly or biweekly review schedule.
- Ignoring multi-team visibility and reporting needs - An effective OKR dashboard should enable seamless tracking of progress across teams, fostering transparency, alignment, and clear reporting for managers and leaders.
Ready To Build an OKR Dashboard That Works?
OKR dashboards empower teams to transform goals into visible, measurable achievements. By linking objectives with real-time data, they enable consistent alignment, early risk detection, and a strong focus on what truly matters.
A key insight gleaned from implementing OKR dashboards is that ongoing reflection and adaptation drive continuous improvement. These dashboards not only benefit the entire organization but also enhance real-time collaboration and strategic alignment across all departments. Furthermore, they are instrumental in tracking strategic objectives, ensuring collective movement in the same direction.
If your goal is to construct or enhance an OKR dashboard that fosters genuine execution beyond mere reporting, Versich is here to assist. Contact us today to discuss how we can design an OKR dashboard tailored to your teams and objectives!