Building a Centralized Data Warehouse to Unify Reporting and Boost Power BI Performance

Building a Centralized Data Warehouse to Unify Reporting and Boost Power BI Performance
Power BI Reports Unified

45+

Power BI Reports Unified

Disconnected Systems Eliminated

8

Disconnected Systems Eliminated

Expert Team Members Deployed

5

Expert Team Members Deployed

User Groups with Granular Access

10+

User Groups with Granular Access

Background The Client Challenge

Our client is a well established distributor of an internationally recognized bottled water brand, operating for over two decades. With a strong focus on sustainability, the company has been reducing plastic usage across its packaging and continues to grow its market presence.

Despite already using Microsoft Power BI for reporting across sales, marketing, and corporate finance, the company was struggling with a fundamentally broken reporting setup. Over time, each of the 45+ reports had been built in isolation with its own data sources, its own transformation rules, and its own KPI logic. Nobody owned the overall picture.

  • KPIs like revenue, margin, and sales volume were being calculated differently across reports leading to conflicting numbers in leadership meetings
  • Eight separate systems a mix of cloud databases, on premises databases, and external sources were each connected directly to Power BI
  • Every report execution triggered a fresh round of data pulls and transformations from all eight systems, causing serious performance lags
  • Report developers spent more time fixing data inconsistencies than building new insights
  • There was no central place to define what a KPI meant or where the data came from making audits and governance nearly impossible

The company needed to fix the foundation, not just the reports. They engaged Versich bringing deep Azure data engineering expertise and a strong BI delivery record to design and build a modern, centralized data warehousing solution.

Our Solution

Designing Data & Analytics Architecture

Designing Data & Analytics Architecture

  • Assembled a dedicated project team - Project Manager, Business Analyst, Data Engineer, Solution Architect, and DevOps Engineer.
  • Ran discovery workshops and observation sessions with key stakeholders across all reporting departments.
  • Mapped all eight data sources and documented the role each played across the 45+ existing reports.
  • Identified root causes of KPI inconsistencies and data duplication across the reporting layer.
  • Produced a solution vision document and full architecture design aligned to the client's Microsoft Azure infrastructure.
  • Chose Azure native tools to avoid additional licensing costs and ensure seamless integration with existing systems.
  • Calculated Total Cost of Ownership (TCO) and received full client sign off before development began.

Implementing an Azure-Based Data Warehouse with an OLAP Cube

Implementing an Azure-Based Data Warehouse with an OLAP Cube

  • Built a centralized data warehouse powered by Azure SQL Database.
  • Developed ETL pipelines to clean, validate, deduplicate, and consolidate data from multiple sources.
  • Eliminated reporting silos by creating a single source of reliable information.
  • Implemented an OLAP cube with built in KPI calculation logic and aggregation patterns.
  • Enabled business users to create ad hoc reports.
  • Simplified report creation and maintenance for the IT team.

Data Governance & Security

Data Governance & Security

  • Implemented a centralized metadata catalog for data definitions and lineage management.
  • Improved data consistency, accuracy, and discoverability across all 45+ reports through standardized data definitions.
  • Configured Azure Active Directory based Row Level Security (RLS).
  • Enabled granular access control across ten+ user groups.

Business Impact

Consistent KPI Calculation

Consistent KPI Calculation

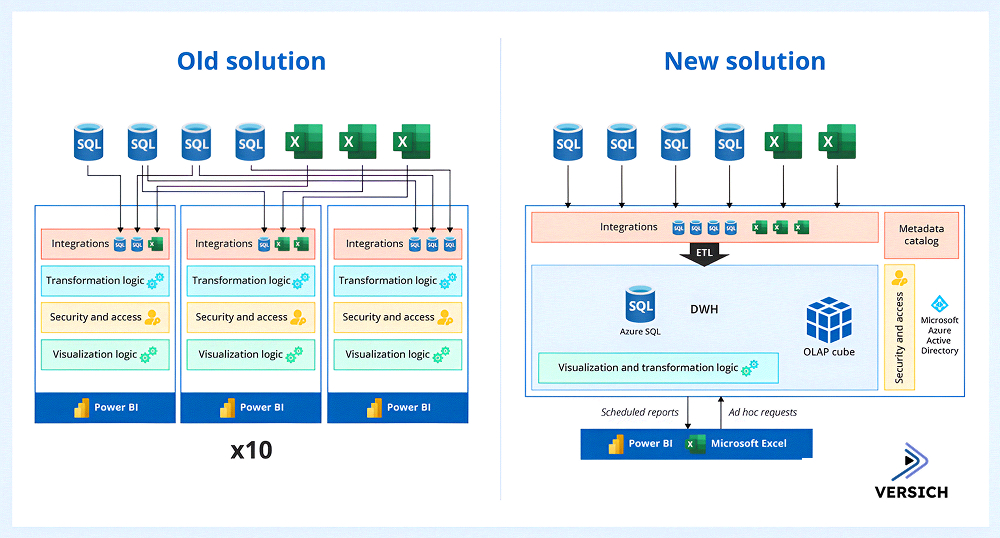
The centralized data warehouse eliminated reporting silos and established a single source of truth across the organization. KPI calculations are now standardized across all reports, reducing duplication and inconsistencies.

Improved Reporting Accuracy

Improved Reporting Accuracy

The combination of ETL validation processes and centralized KPI logic improved the accuracy and reliability of reporting across the business.

Stronger Data Governance

Stronger Data Governance

The metadata catalog and centralized security model improved data governance, transparency, and control over sensitive business information.

Faster Report Development

Faster Report Development

The OLAP cube allows business users to continue using familiar reports while enabling the IT team to create new reports more efficiently.

REVIEWS

What Clients Say About Us

5.0
Full starFull starFull starFull starFull star

We hired Versich to rebuild our analytics stack after an internal project stalled. They came in, assessed the situation quickly, and delivered production-ready Power BI dashboards within weeks. Their DAX knowledge and data modelling skills are exceptional.

Marcus Webb

CTO
5.0
Full starFull starFull starFull starFull star

Versich understood our finance workflows from day one. They built dashboards that connected directly to our ERP and gave our leadership team real-time visibility into cash flow, margins, and budget vs actuals. The quality of the work and the speed of delivery were both outstanding

Priya Nair

Finance Director
5.0
Full starFull starFull starFull starFull star

Before Versich, our reporting was scattered across spreadsheets with no single source of truth. They built us a Power BI environment that connects our warehouse, finance, and sales data in one place. Our operations team now makes decisions in hours instead of days

Daniel Okonkwo

Head of Operations