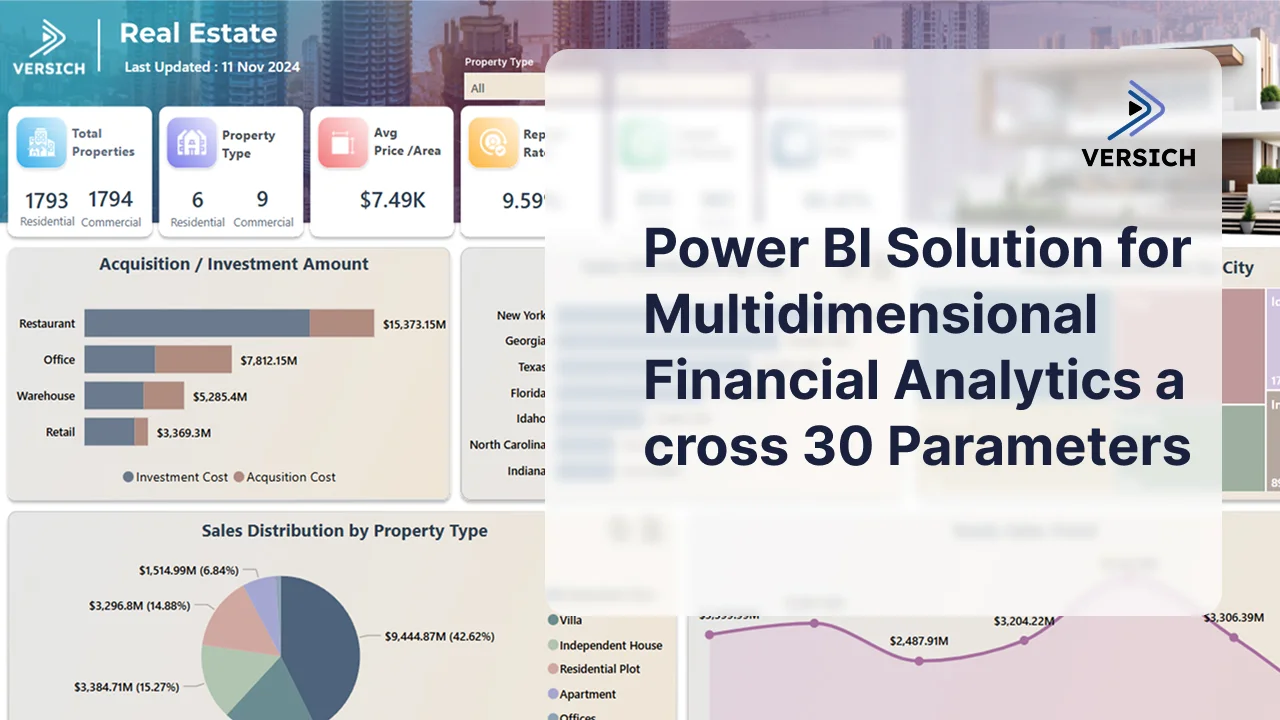
Power BI Solution for Multidimensional Financial Analytics across 30 Parameters
40Data Sources Integrated
30Parameters Analysed
17Reports Delivered
5Dashboards Delivered
Our client is an international real estate developer headquartered in California, specialising in commercial and residential property development with a team of around 1,500 employees.
To gain deeper insight into their business performance, the client needed comprehensive financial reporting but faced critical gaps.
The client needed an efficient Power BI reporting platform built on clean, aggregated data to bring everything together.
Reports show data for both the entire company and individual branches, with full attribute filtering across branch hierarchy, accounts, and dates.
17 reports and 5 dashboards gave the client a full view of aggregate financial data from any perspective, enabling deeper understanding of performance across the organisation and individual branches.
The client gained the ability to analyse cash flow, identify trends, and react quickly to a changing business environment with a single consolidated source of truth.
We hired Versich to rebuild our analytics stack after an internal project stalled. They came in, assessed the situation quickly, and delivered production-ready Power BI dashboards within weeks. Their DAX knowledge and data modelling skills are exceptional.
Versich understood our finance workflows from day one. They built dashboards that connected directly to our ERP and gave our leadership team real-time visibility into cash flow, margins, and budget vs actuals. The quality of the work and the speed of delivery were both outstanding
Before Versich, our reporting was scattered across spreadsheets with no single source of truth. They built us a Power BI environment that connects our warehouse, finance, and sales data in one place. Our operations team now makes decisions in hours instead of days