Report Examples from Our Previous Projects
At Versich, we don’t just talk about data transformation, we deliver it. Our Power BI portfolio highlights projects across industries where we’ve helped clients unlock insights, improve decision making, and achieve measurable ROI. making, and achieve measurable ROI.
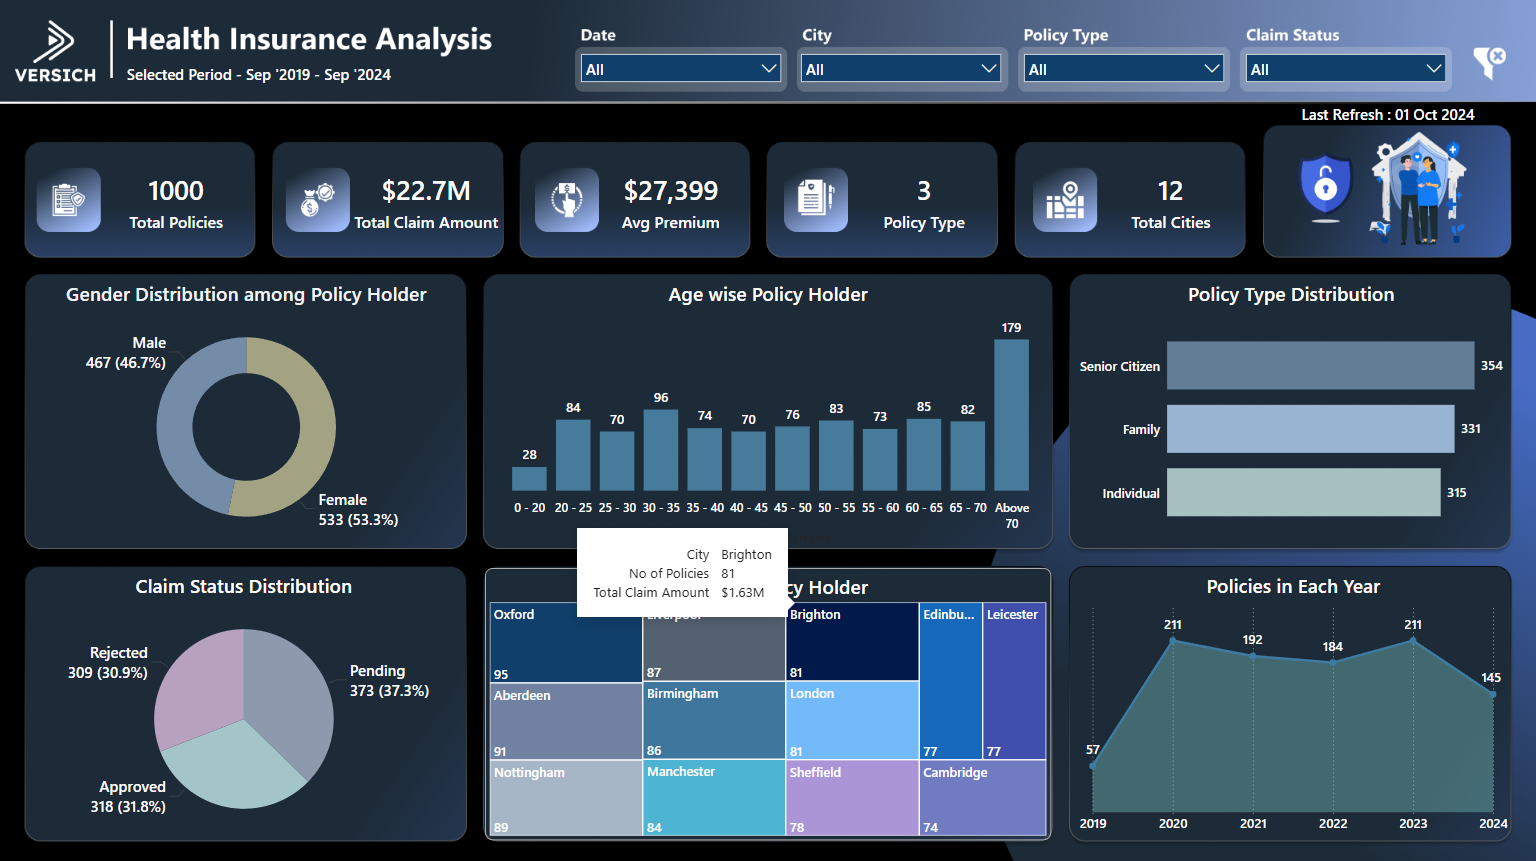
Health Insurance Analysis
The Health Insurance Analysis Power BI project delivers advanced insights into claims, policy performance, and customer demographics, empowering insurers with actionable intelligence for risk assessment and service improvement.
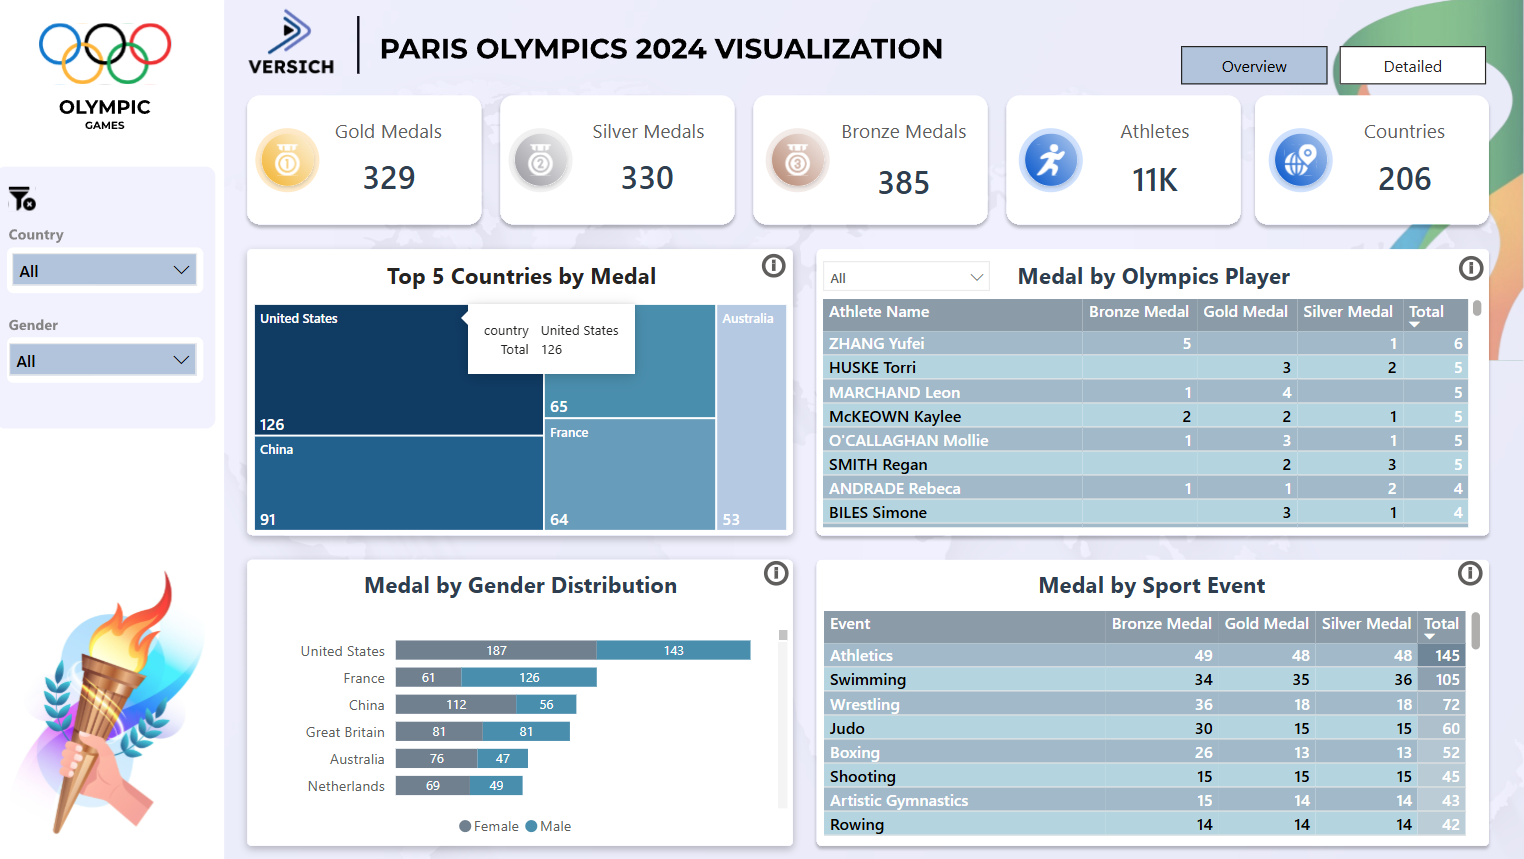
Paris Olympics 2024
The Paris Olympics 2024 Power BI project visualizes athlete and country performance, medal tallies, and event statistics, offering an engaging way to explore Olympic data.
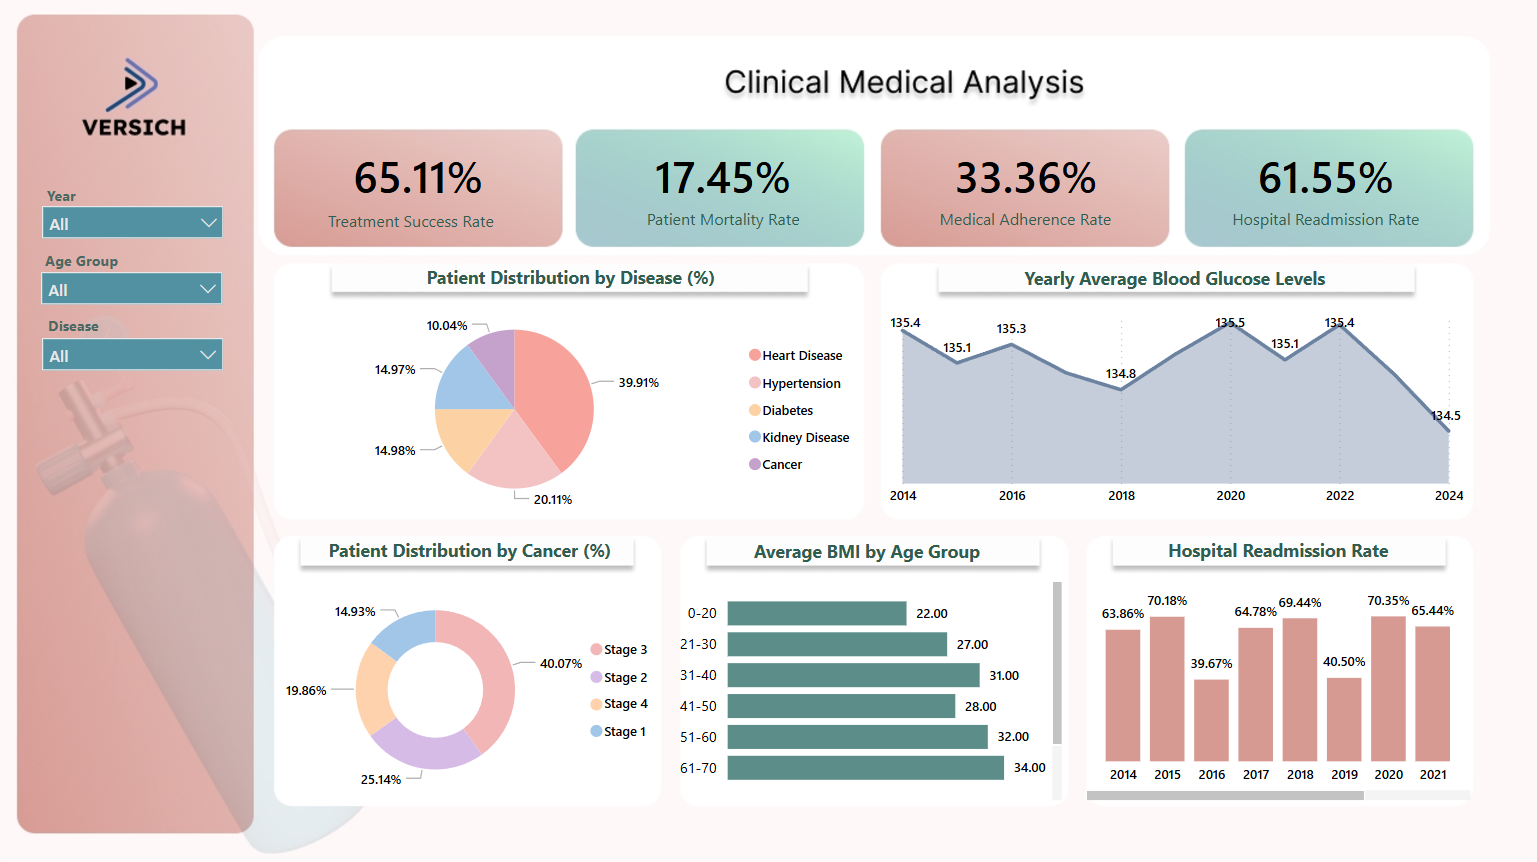
Clinical Medical Analysis
The Clinical Medical Analysis Power BI project provides detailed visualization of clinical data, enabling healthcare professionals to monitor patient outcomes and treatment effectiveness.
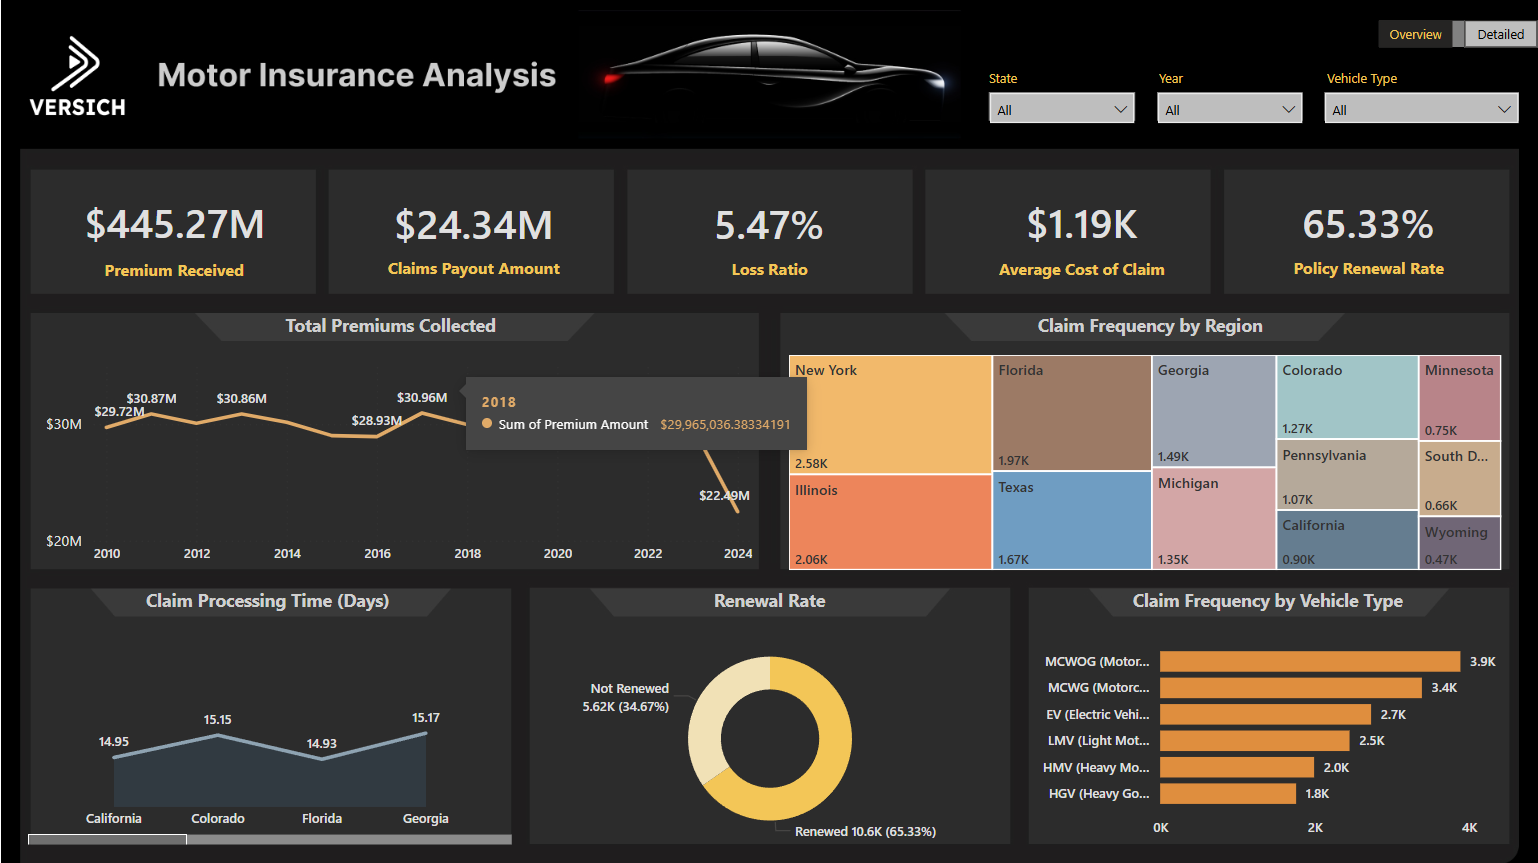
Motor Insurance
The Motor Insurance Power BI project delivers in-depth analysis of claims and policy metrics, helping insurers optimize offerings and improve customer service.
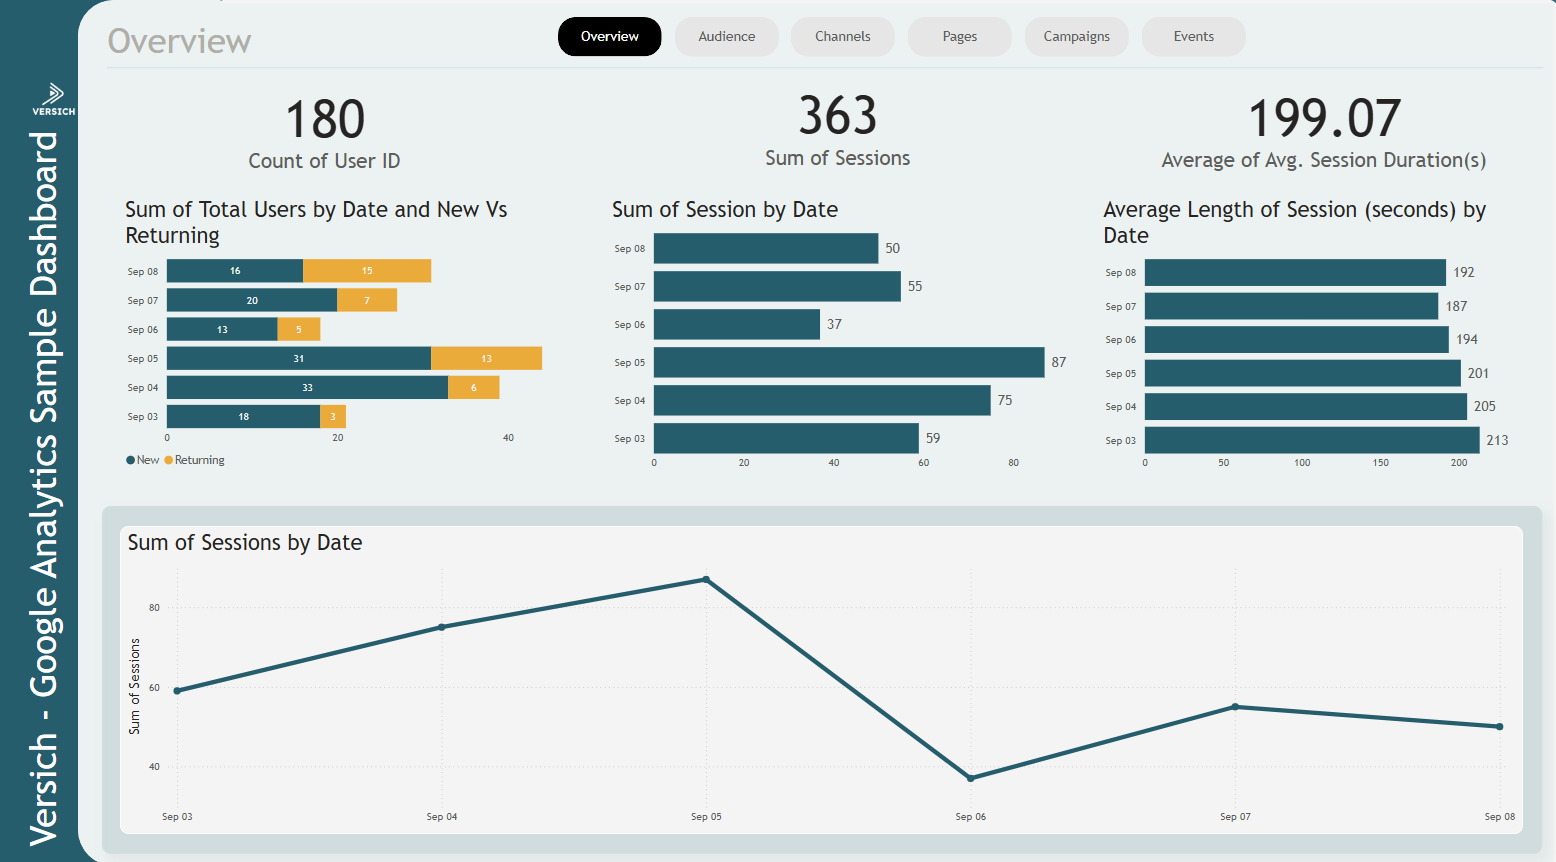
Google Analytics
The Google Analytics Power BI project transforms web traffic data into actionable insights, helping businesses optimize marketing and digital strategies.
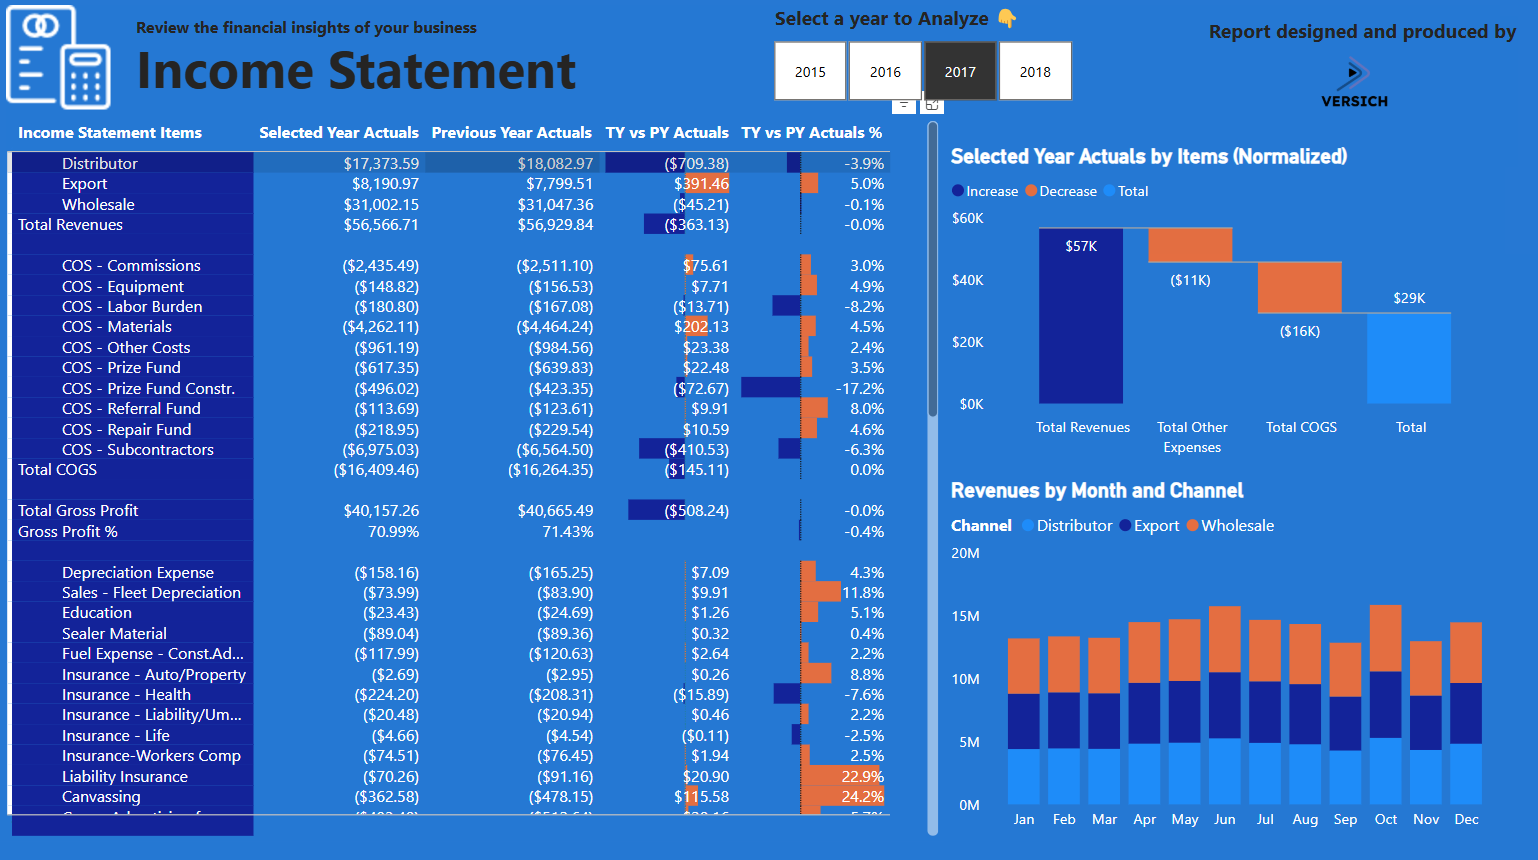
Income Statement
The Income Statement Power BI project provides comprehensive financial analysis, visualizing revenue, expenses, and profitability for performance evaluation.
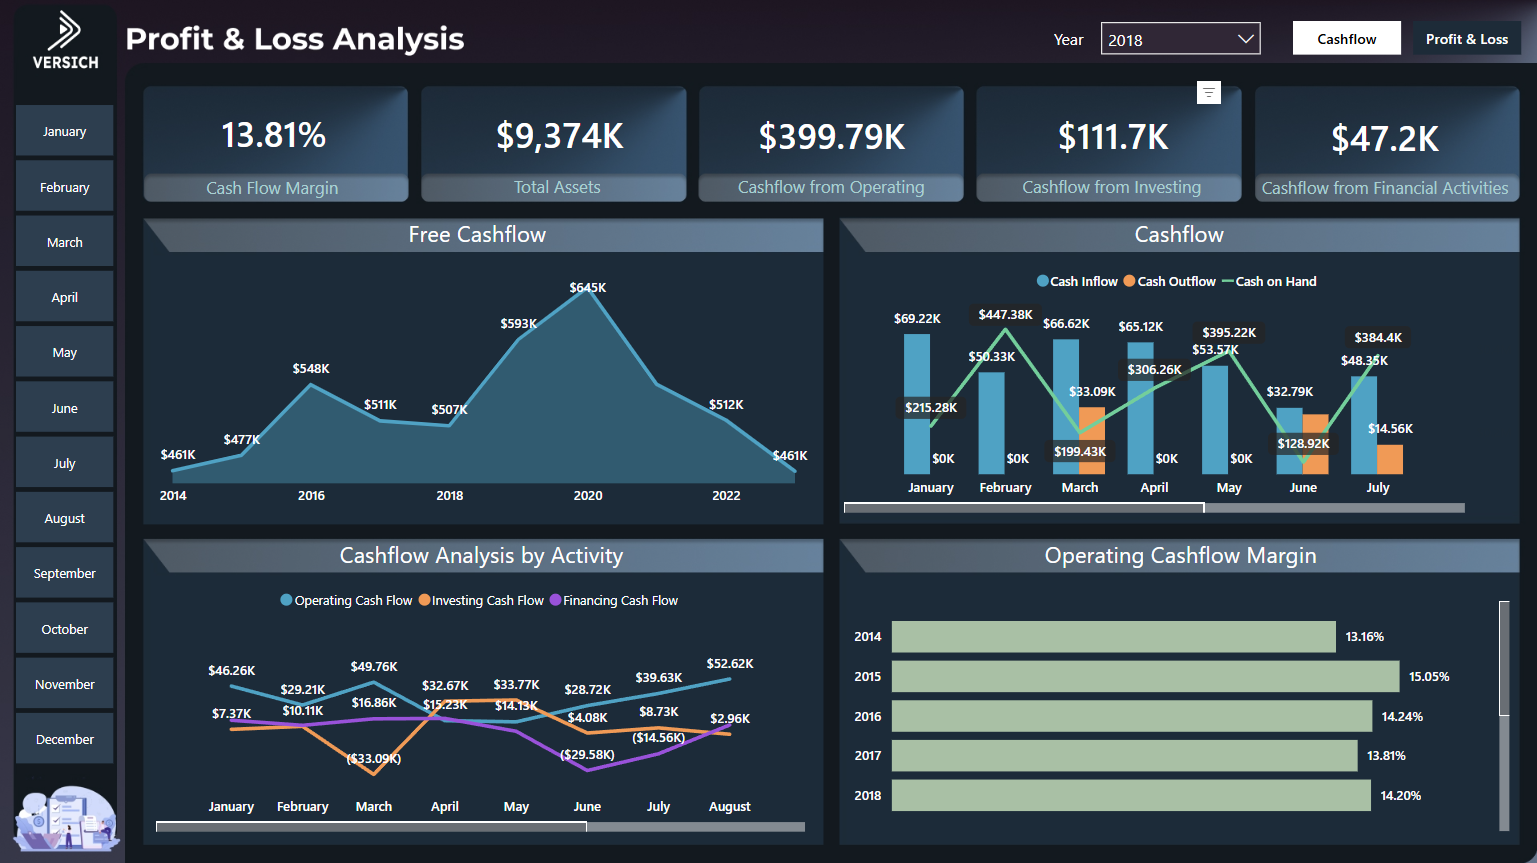
Cashflow and Profit & Loss Analysis
The Cashflow and Profit & Loss Analysis Power BI project offers a holistic view of financial health, tracking cash inflows, outflows, and profitability metrics.
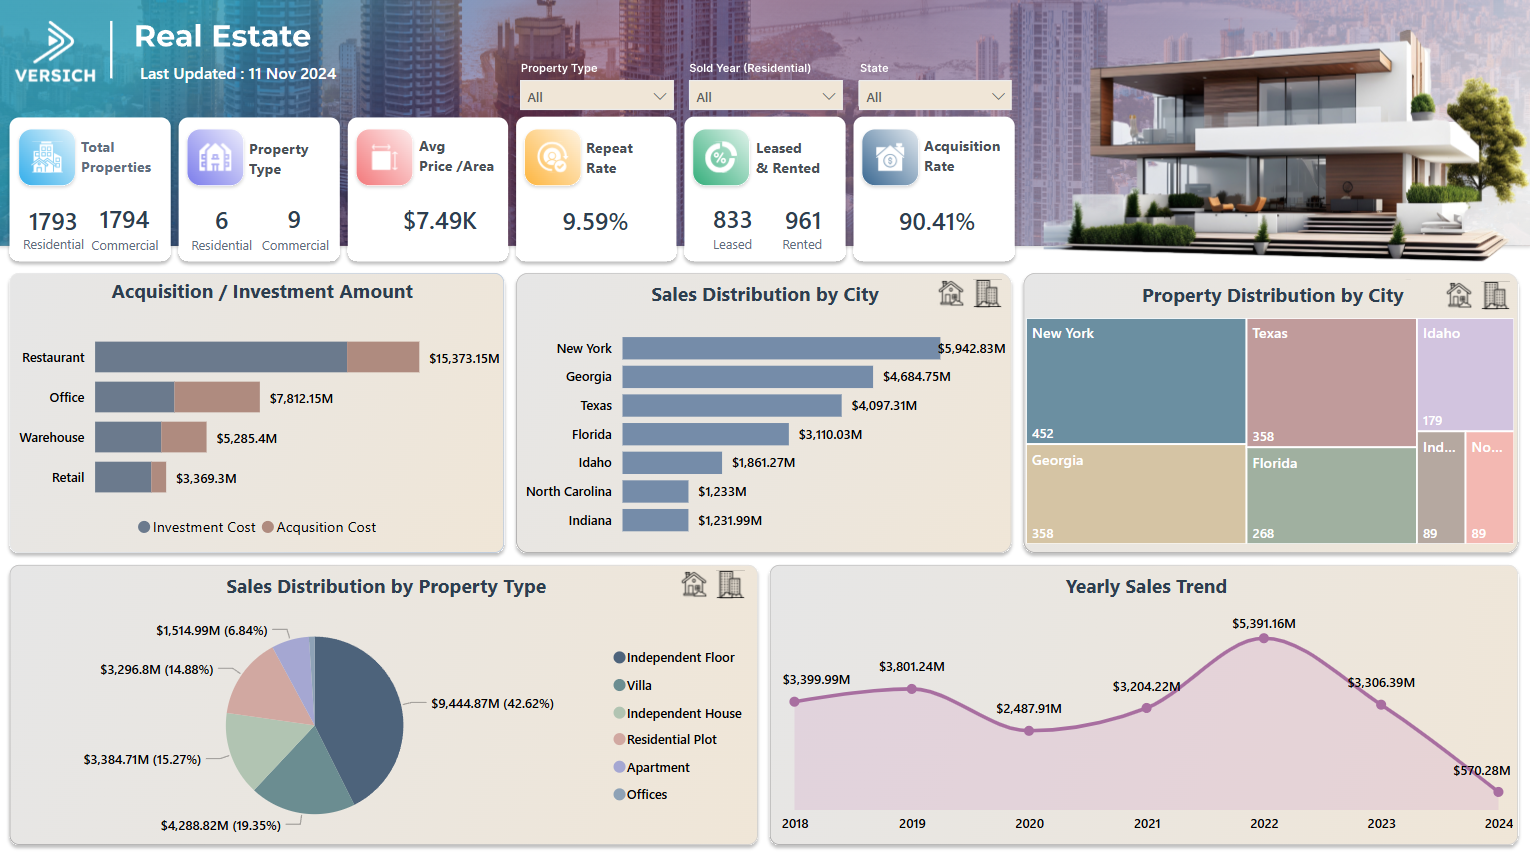
Real Estate Analysis
The Real Estate Analysis Power BI project provides detailed insights into property market trends, rental yields, and investment performance.